“In Xanadu did Kubla Kahn a stately pleasure-dome decree: Where Alph, the sacred river, ran through caverns measureless to man down to a sunless sea.” Samuel Taylor Coleridge
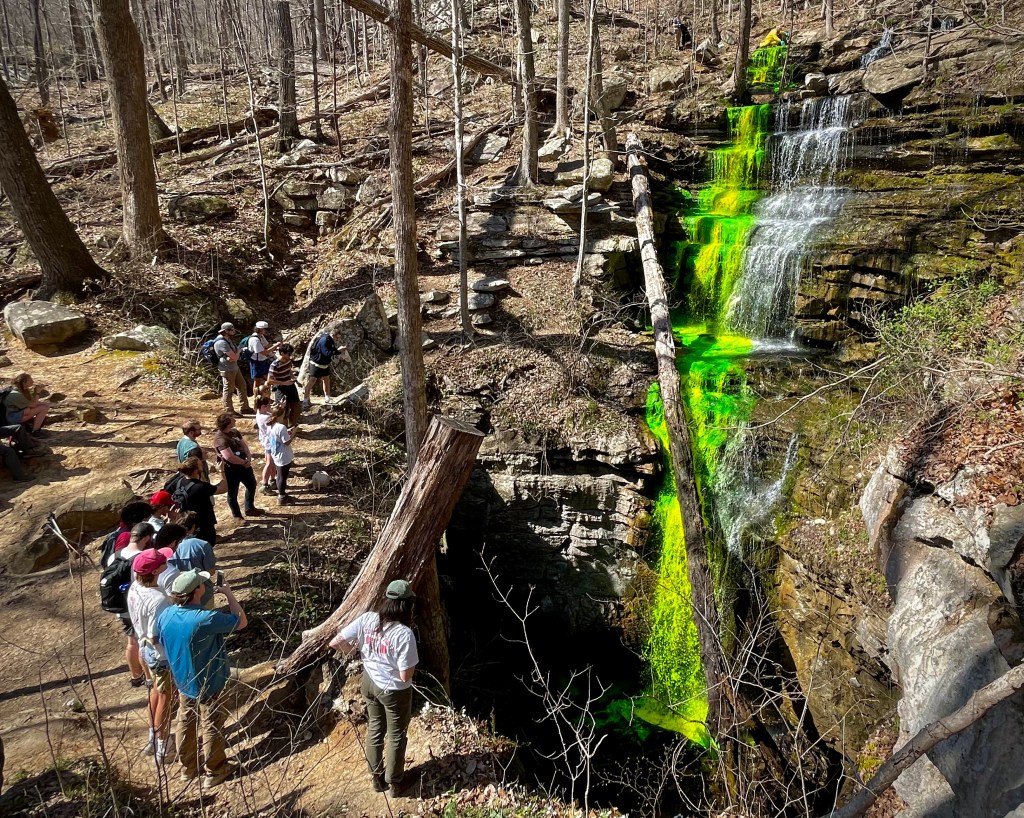
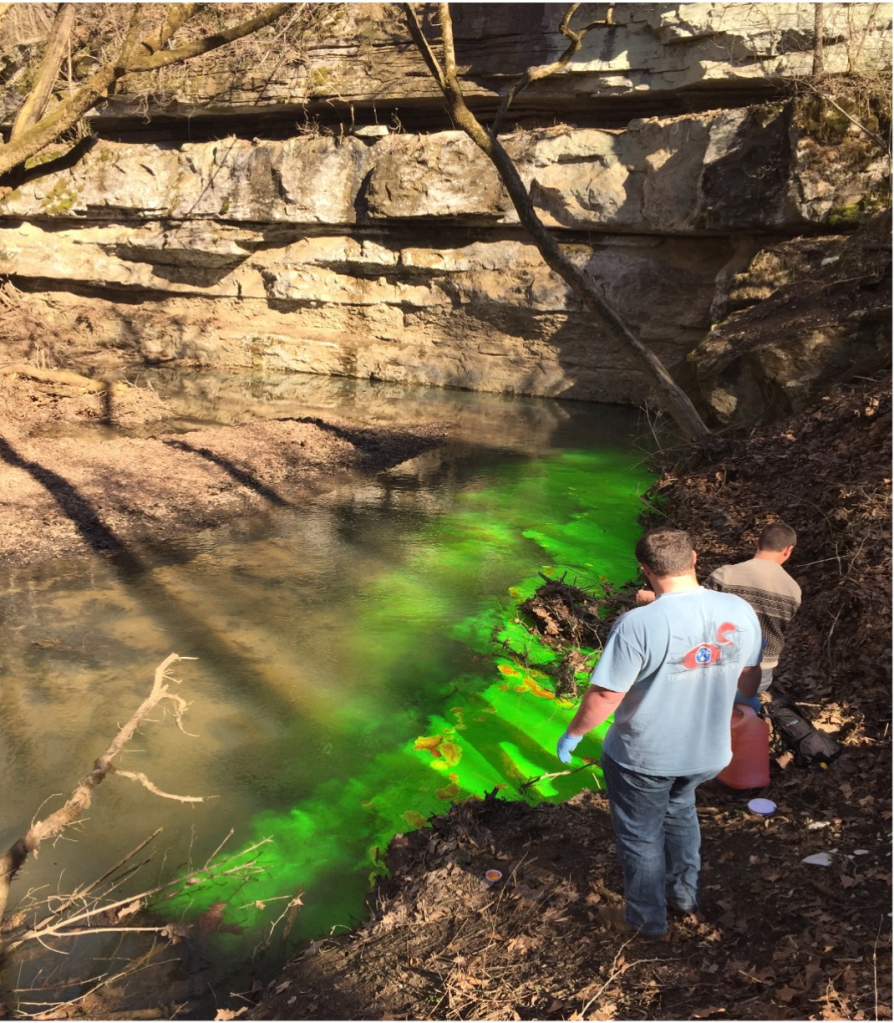
Fluorescein dye being placed into Bridal Veil Falls in Sewanee, TN as part of a United States Geological Survey (USGS) study of groundwater flow to springs in Cowan, TN that supply the community’s drinking water.
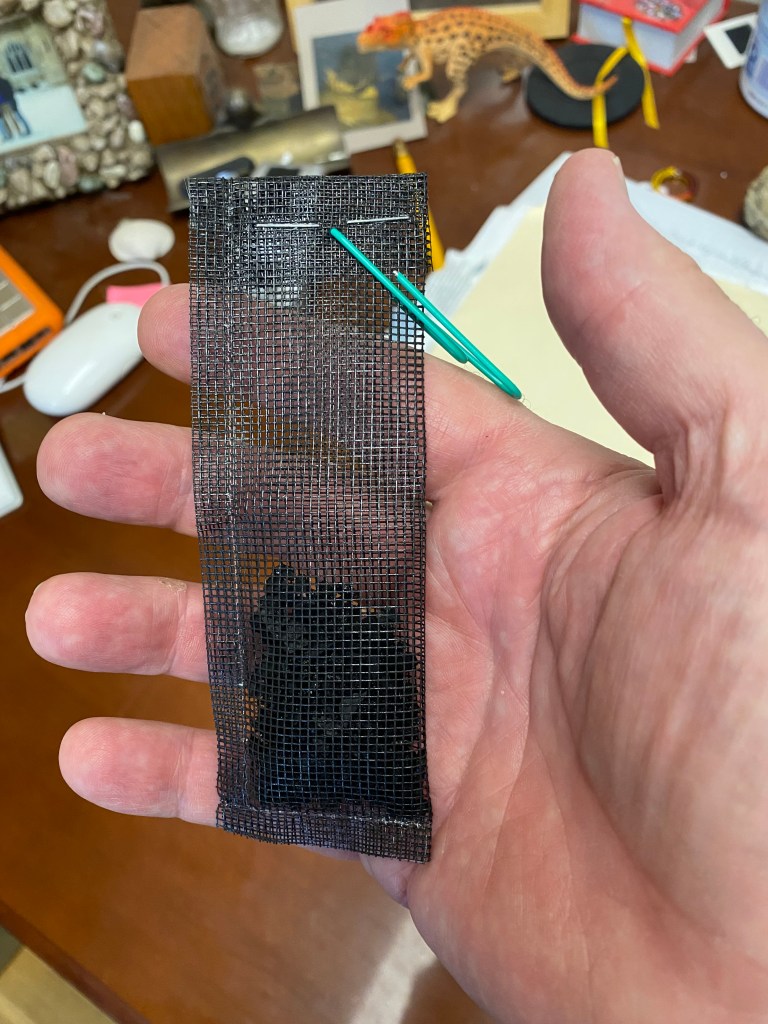
As stream water cascades off the sandstone cap of the Cumberland Plateau it washes across the limestone layers that form the lower two-thirds of the escarpment. Since the water is acidic (pH of 4.5 – 5.5) it dissolves the limestone. The water is preferentially diverted into cracks (“joints” in geology-speak) and along horizontal partings in the rock. These are enlarged into ever bigger openings and can therefore take up even more water. This feedback mechanism eventually leads to the development of caves within the limestone. Many of these caves are accessible by humans and in this situation streamflow can be observed directly. There are, however, many more situations where the cave passages are too small to enter and where the path of water flow can only be guessed. One of the great challenges for hydrologists is to determine the flow of water through inaccessible cave systems. This is important because flow paths tell us where drinking water comes from and the directions that contaminants may take underground. So how do hydrologists determine the flow of hidden water through caves? The most effective way to do is is through dye tracing. With this technique, a colorful dye such as green fluorescein is added to stream water where the water enters the ground. Where the dye reemerges from the ground downhill then marks the general path of the water in the subsurface. The reemergence can be timed to give an idea of the average flow rate underground between the two points. In a karst (limestone cavern) system the reemergence can occur at more than one location and can manifest itself as a spring or flow into a stream. It is very satisfying to actually see the dye emanating from the ground, but sometimes it is invisible due to too much dilution. To get around this problem charcoal packets can be placed into suspected resurgence points before the dye is added to the ground. Even if the dye is diluted, very small traces of the dye will be picked up by the charcoal and can be detected in the laboratory.
Typical charcoal packet used to detect tiny amounts of dye.
Fluorescein dye is harmless in the environment and is even used in medical procedures. All dye tracing events in Tennessee must be approved of in advance by the Tennessee Department of Environment and Conservation (TDEC). The amount of dye used must also be matched to the volume of water flowing into the ground at any particular location.
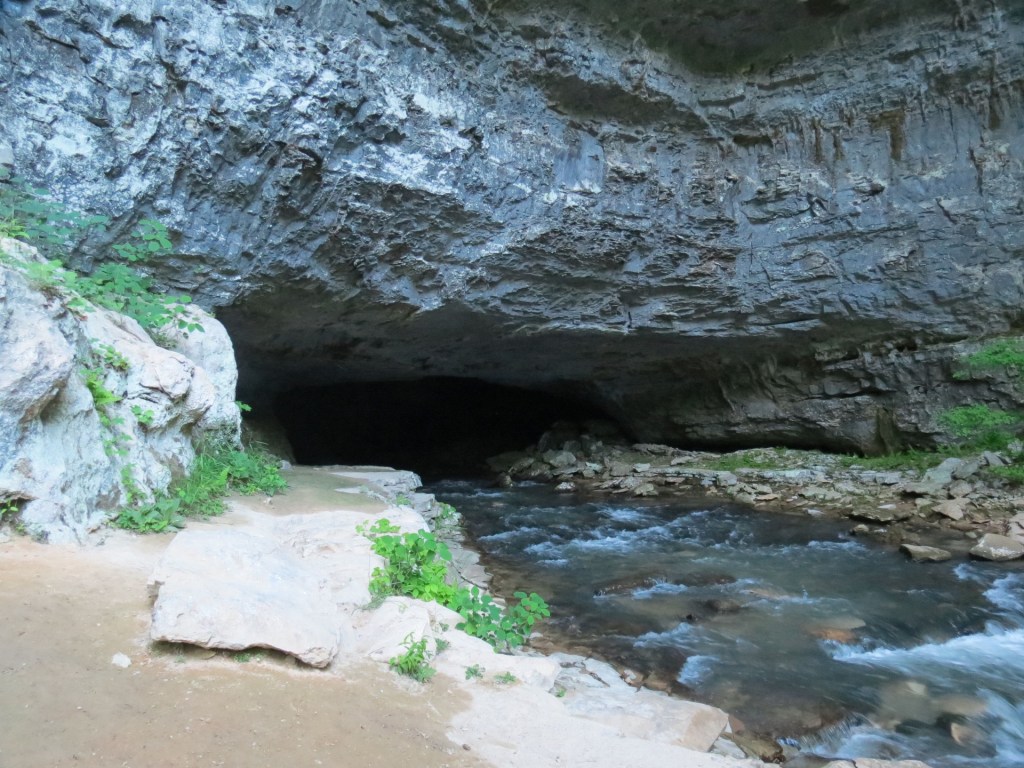
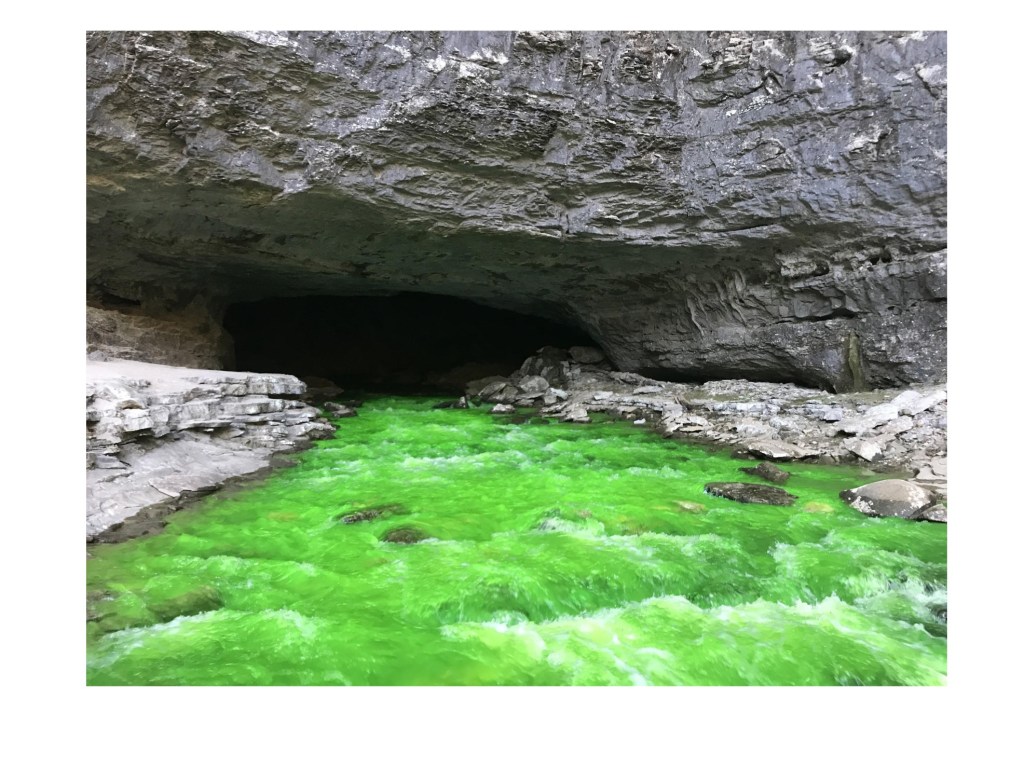
Let’s look at an example of a fairly straight forward dye tracing investigation involving Buggytop Cave, part of the Head of the Crow State Park system near Sewanee, Tennessee. The cave entrance is one of the most spectacular in the southeastern United States and boasts a vigorous stream coming out of it.
Buggytop Cave with exiting stream in the Head of the Crow State Park near Sewanee, TN.
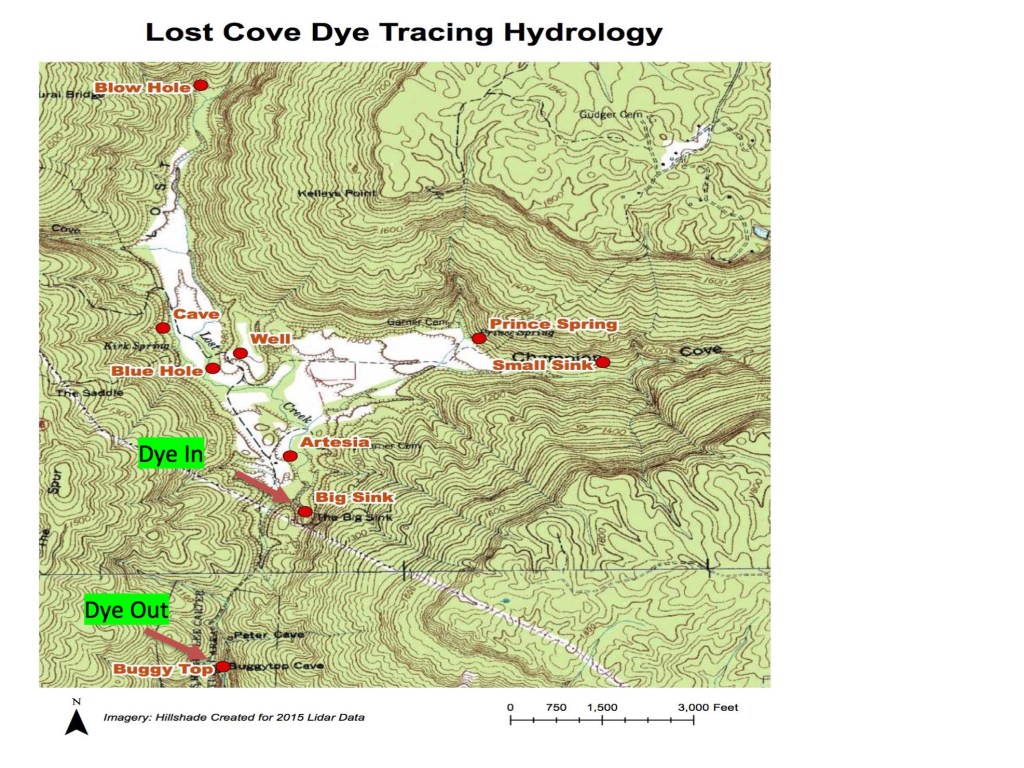
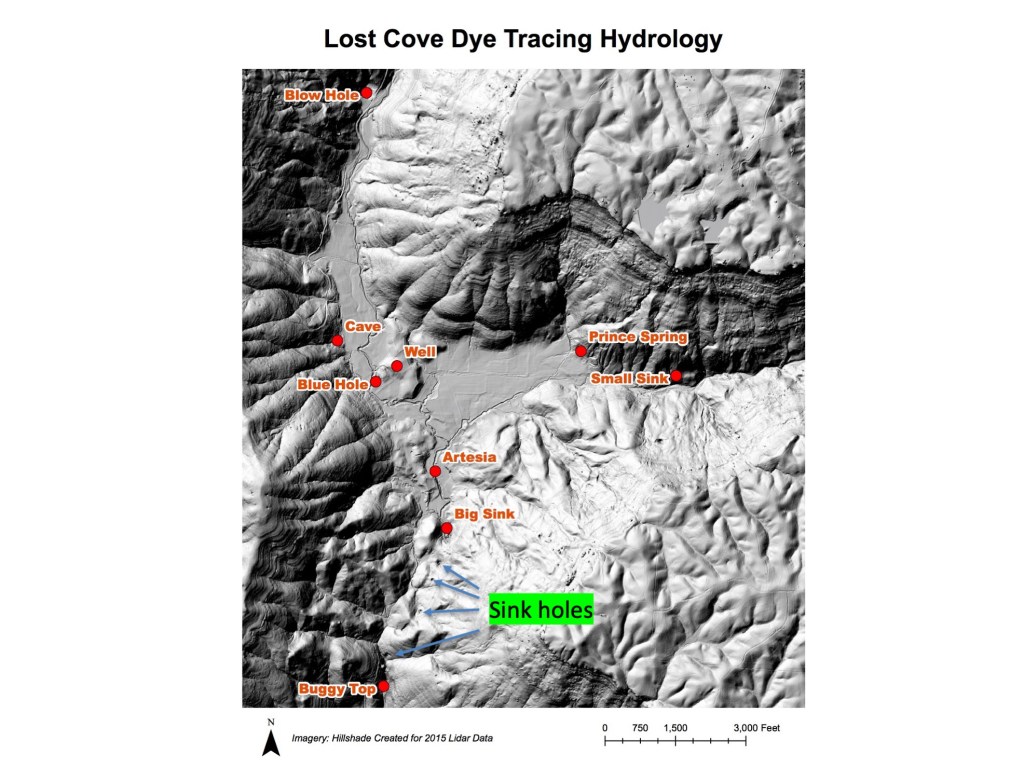
People often wonder where the stream water has its origins. It was long suspected that the water came from a large sinkhole called “The Big Sink,” which is situated about 3700 feet (0.7 miles) away higher up on the flanks of the Cumberland Plateau at the end of a large valley called Lost Cove (see map below).
Topographic map of a portion of Lost Cove showing location of dye injection (Big Sink)and Buggytop Cave mouth (where the dye came out) to the southwest.
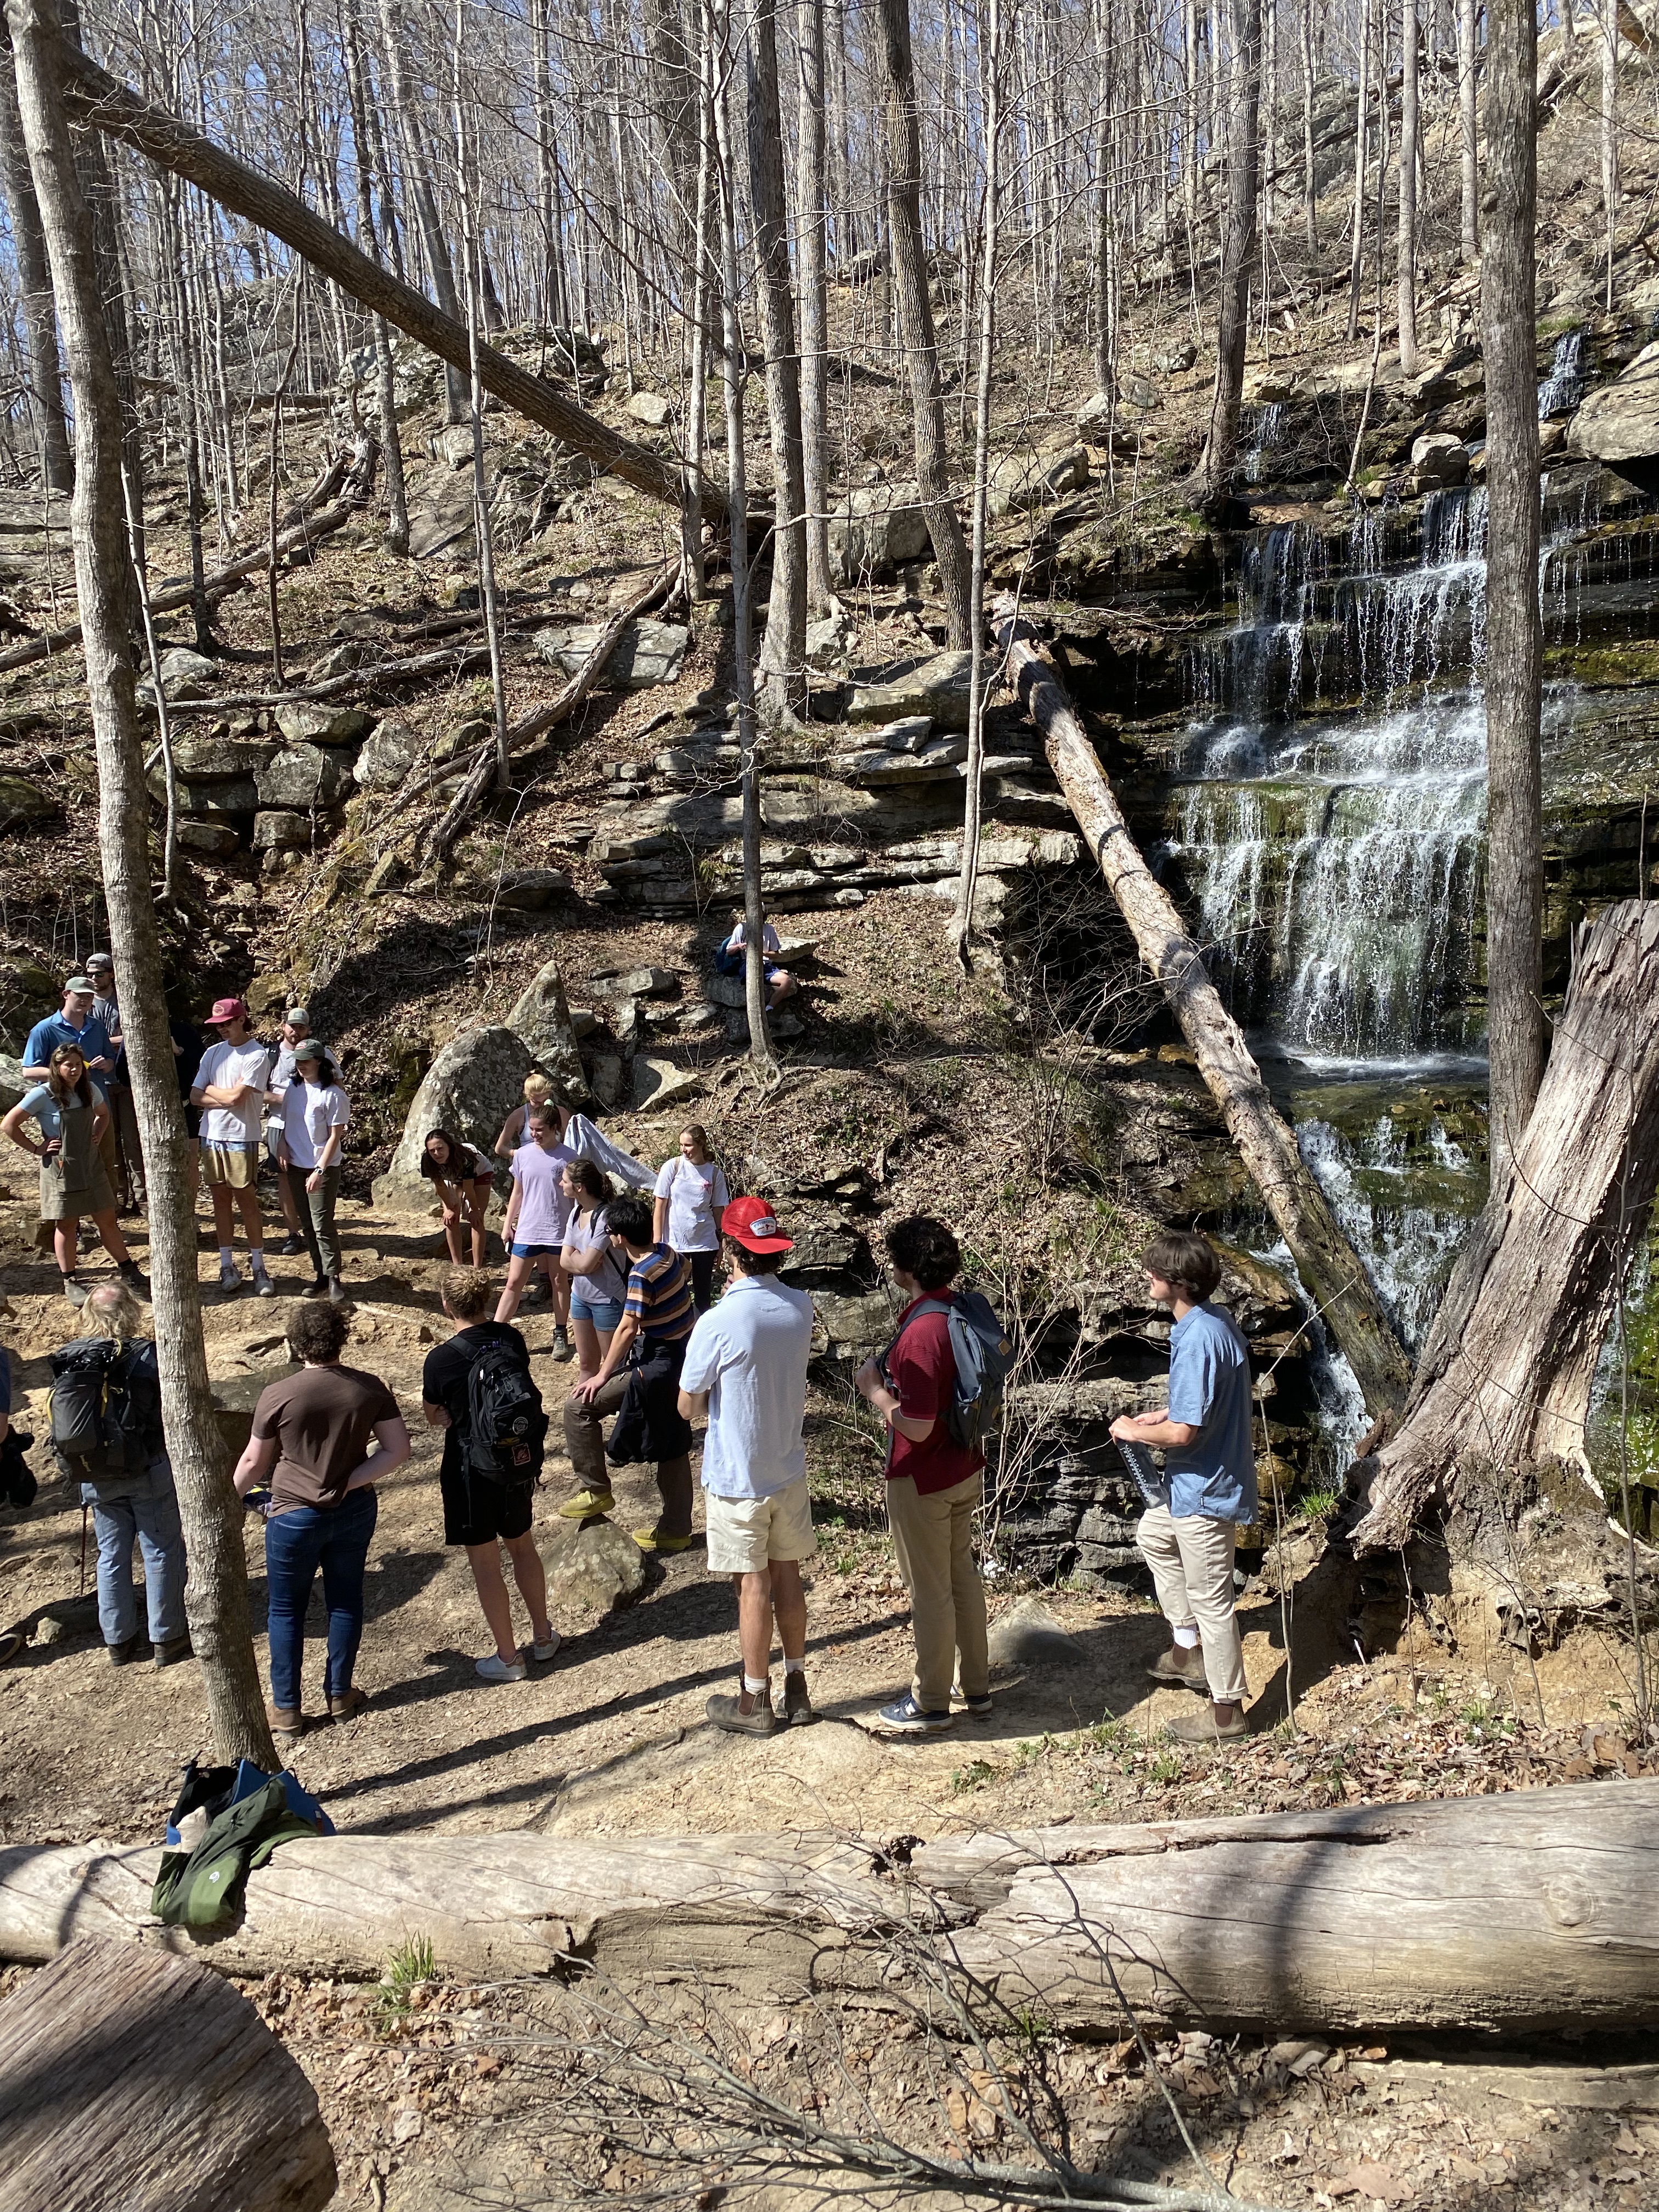
During heavy rains the Big Sink acts like a huge drain for a large portion of Lost Cove. Does the water make its way southwestward under a ridge, run through Buggytop Cave and then exit at the cave’s lower entrance? To find out, some students in my hydrology class injected fluorescein dye into the Big Sink, while others were stationed at the opening to Buggytop Cave.
Students injecting dye into the Big Sink.
After 20 minutes a radio call from students stationed at Buggytop Cave confirmed the arrival of the dye there. Thus we know that at least a large portion of the streamwater in Buggytop Cave comes from the Big Sink in Lost Cove, and that it takes about 20 minutes for the water to make this underground journey of about 0.7 miles. The time likely varies with flow volume.
Dye emerging from Buggytop Cave after its 20 minute, 0.7 mile journey underground from the Big Sink in Lost Cove.
A LIDAR image of the area shows a tantalizing line of sinkholes between the Big Sink and the upper part of Buggytop Cave. Perhaps this represents a mostly collapsed cave system along which the water moves, but that is too narrow for human exploration.
LIDAR image of study area showing four sinkholes in a line between Buggytop Cave and the Big Sink.
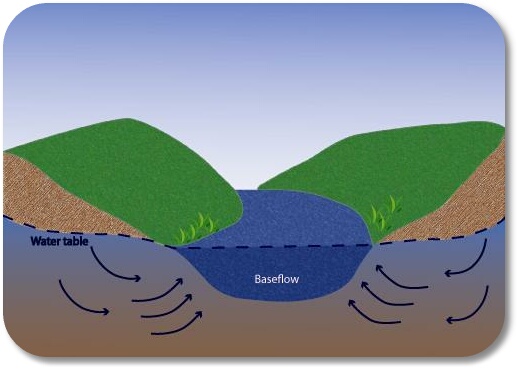
Streams and their tributaries are the most prominent features of any watershed in the eastern United States. When we walk or drive across a watershed, we correctly expect to encounter a stream at the lowest crease in the landscape. It’s relatively easy to understand that the stream has carved through the valley on its way downhill and out of the watershed. But how does the water get into the stream, or its tributaries, in the first place? When it rains only a small portion of water falls directly into the stream. During very heavy downpours we might see some water washing over land surfaces that usually don’t have any water on them. But why do streams still contain water days, weeks and months after the last rain? On the Cumberland Plateau and in many other regions of the Tennessee River Valley most of the water actually enters streams as baseflow. This is rainwater that has infiltrated the soil, moved its way down to the water table, and then moved laterally into the stream to sustain its flow long after the last rains have ceased. This process is invisible to us since it takes place within the ground and beneath the stream surface.
Baseflow entering a stream. Source: The Groundwater Dictionary.
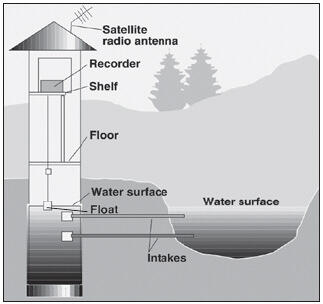
Baseflow enters the stream long after a rain event has taken place, but the amount of water added to the stream from the ground will diminish over time if not resupplied by rainfall. This is seen at the surface as a drop in stream level. How do we study and measure changing stream levels due to changes in baseflow? Most hydrologists pick a spot along a stream where the cross sectional area of the stream can be measured. Then they employ an electronic water level measuring device that is installed in a stilling well on the stream bank. The stilling well is connected to the stream and therefore shows the actual stream level at any time in a calm (“stilled”) environment.
A stilling well. Pipes connect stream to the well, providing for a quiet, still setting to measure water level. Source: United States Geological Survey.
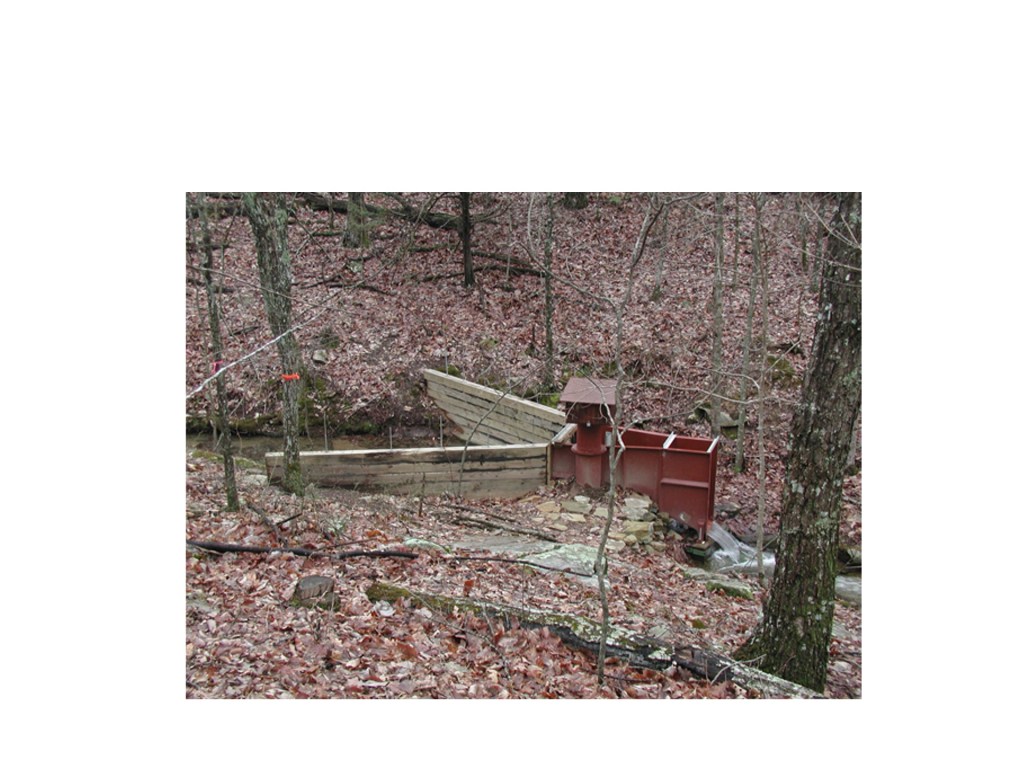
Such an arrangement has been placed on the completely forested, 50-acre Split Creek watershed atop the Cumberland Plateau in Sewanee, Tennessee. Here a flume has been installed to collect all the stream water before it leaves the watershed on the edge of the plateau. A stilling well is attached to this flume and records water levels several times per minute.
The Split Creek flume with stilling well catches all the stream water before it exits the watershed and heads down the plateau to the right.
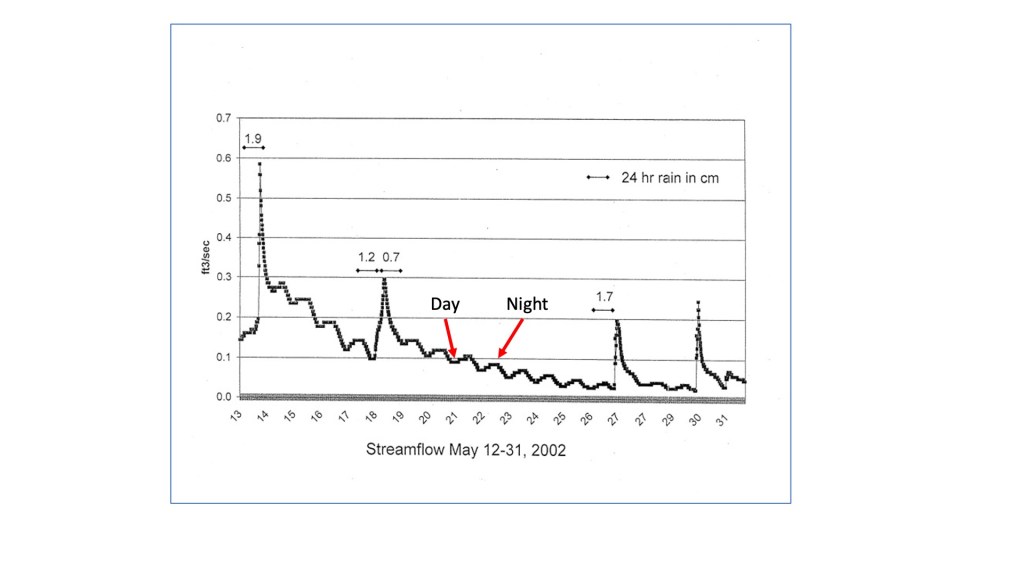
Data from this stilling well is plotted on a stream hydrograph and enables us to observe changes in stream level with changing rainfall and baseflow. The stream hydrograph below depicts 20 days of measurements taken in May of 2002 at Split Creek.
Stream hydrograph from Split Creek watershed in Sewanee, Tennessee. See text for explanation of what is depicted. Source: Dr. Karen Kuers, University of the South.
The Y-axis (vertical) shows stream flow in ft3/sec at the point where the stream leaves the watershed, but this can simply be viewed as stream level, where moving up on the axis indicates a higher level. The X-axis (horizontal) shows time in terms of days during May of 2002. So, what does this graph show us? The most obvious trend (reading from left to right) over the 20 days is the overall gradual drop in stream level. This is in spite of the four rain events which show up as brief, steep rises in stream level. The amount of precipitation in cm for each event is indicated by the bars above the spikes. One of the most interesting trends is shown by the daily, small bumps on the hydrograph. What would make the stream level rise and fall on such a daily (or diurnal) basis? This is the work of the deciduous forest which completely covers the watershed. During the growing season all plants from grasses and bushes near the forest floor right up to the tallest trees in the upper canopy take water up through their roots so that they can carry on the process of photosynthesis, whereby new biomass is created. This uptake of water by the forest is a daytime process, resulting in a temporary drop in the water table and in the amount of basefow entering into the stream. A kind of “inhalation” of water by the forest. On the hydrograph this shows up as one of the daily depressions (labeled “Day”) when the stream level is lowered. When the plants stop pumping water up during the night, the water table and baseflow rebound, leading to a “bump” on the hydrograph (labeled “Night”), indicating a rise in stream level. This diurnal spectacle represents the collective “breathing” of the forest. Where does all the water taken up by plants go? The vast majority leaves the plants during the sunlight hours as water vapor from small pores (stomata) on the undersides of leaves. This process is called transpiration.
Transpiration returns water to the atmosphere, where it condenses to form clouds, and ultimately rain.
Clouds from transpired water that has condensed over the forest. Source: Sugi Project.
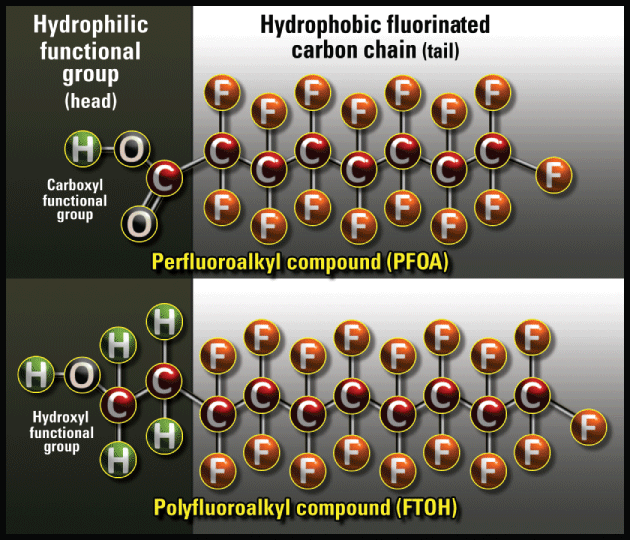
PFAS chemicals are a group of synthetic polymers (long chain molecules) that, once created, have a very long lifespan in the environment. This is why they are often referred to as “forever chemicals” or “persistent pollutants.” They are long-lived due to the fact that the bonds between the carbon and fluorine atoms in the structure are extremely strong. It takes a temperature of 1450°C to break these bonds – temperatures found in nature only in areas of volcanic activity. PFAS chemicals were first created in the 1930’s and there are now thousands of various forms of them that are used in a wide variety of applications including non-stick cookware (including Teflon), water and stain resistant coatings on clothing, carpets and furniture (including Scotchgard), food packaging and firefighting foam (Aqueous film-forming foam, or AFFF). The unique structure of PFAS chemicals makes them ideal for these applications. As seen in the diagram below, the “tail” of the molecule is hydrophobic, meaning it repels water and oil, while the hydrophilic “head” of the molecule interacts with water. This means that PFAS compounds act as surfactants, reducing the surface tension between substances. When introduced into water, PFAS compounds therefore tend to congregate at the surface with tails held up out of the water and heads into the water. This is an important consideration for sampling for PFAS in water, as surface samples should provide the greatest concentration of chemicals and provide a “worst case” scenario for a particular water body.
PFAS compounds are ubiquitous in the environment, having been found in living organisms, rivers, lakes, ponds, sediment and, most recently, in the snows of the Matterhorn and other European alpine peaks. They tend to be concentrated in areas of PFAS manufacturing, storage or disposal, or at airports and military air bases where firefighting foam containing AFFF has been used. PFAS compounds tend to bioaccumulate in the living tissues of organisms where they pose a variety of health concerns. Although these myriad potential effects are beyond the scope of this post, the diagram below provides a good summary of possible problems produced in the human body.
How PFAS compounds are thought to impact human health. (Source: European Environment Agency)
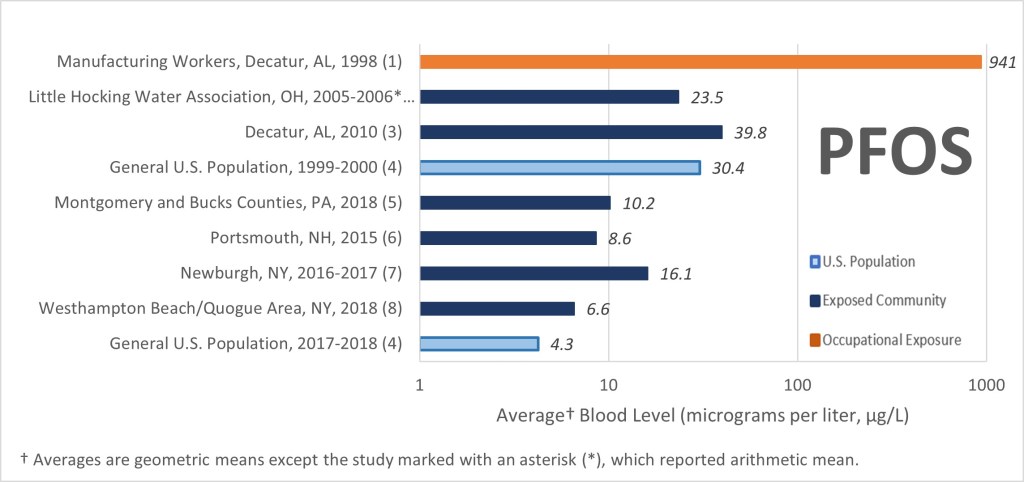
PFAS compounds are considered so toxic that even extremely small quantities in the environment are of concern. This is why they are measured in parts per trillion (ppt, or nanograms per liter, ng/l). One part per trillion is about the same as one drop of water in 20 olympic-size swimming pools. Studies have shown that most Americans have some amount of PFAS in their blood. The diagrams below show trends in blood contamination by two types of PFAS compounds, PFOA and PFOS, for three groups of people in the US over a period of 20 years. These groups include workers in PFAS manufacturing facilities, communities with PFAS-contaminated drinking water, and the general population. The reduction in concentrations over time is due to the gradual phase-out of these two particular chemicals since the early 2000’s. Of course, other PFAS compounds still in use likely don’t follow this trend.
The above two diagrams show PFOA and PFOS concentrations in the blood of people in the general US population, manufacturing workers using these compounds, and named communities with drinking water contaminated by these compounds. Notice that the units are in micrograms per liter, or parts per billion – ppb. To convert to ppt, simply multiply the stated number by 1000.(Source: Agency for Toxic Substances and Disease Registry of the Center for Disease Control)
The US Environmental Protection Agency (EPA) has regulated five PFAS compounds in drinking water. Interestingly, the maximum contaminant levels permitted in drinking water for PFOA and PFOS are 4 ng/l, or 0.004 ug/l (ppb). Compare this number to the levels found in the blood of humans. The reason for the much higher PFAS and PFOS concentrations in blood compared to what is permitted in drinking water is the bioaccumulation effect of the chemicals and the years-long exposure of humans to the chemicals.
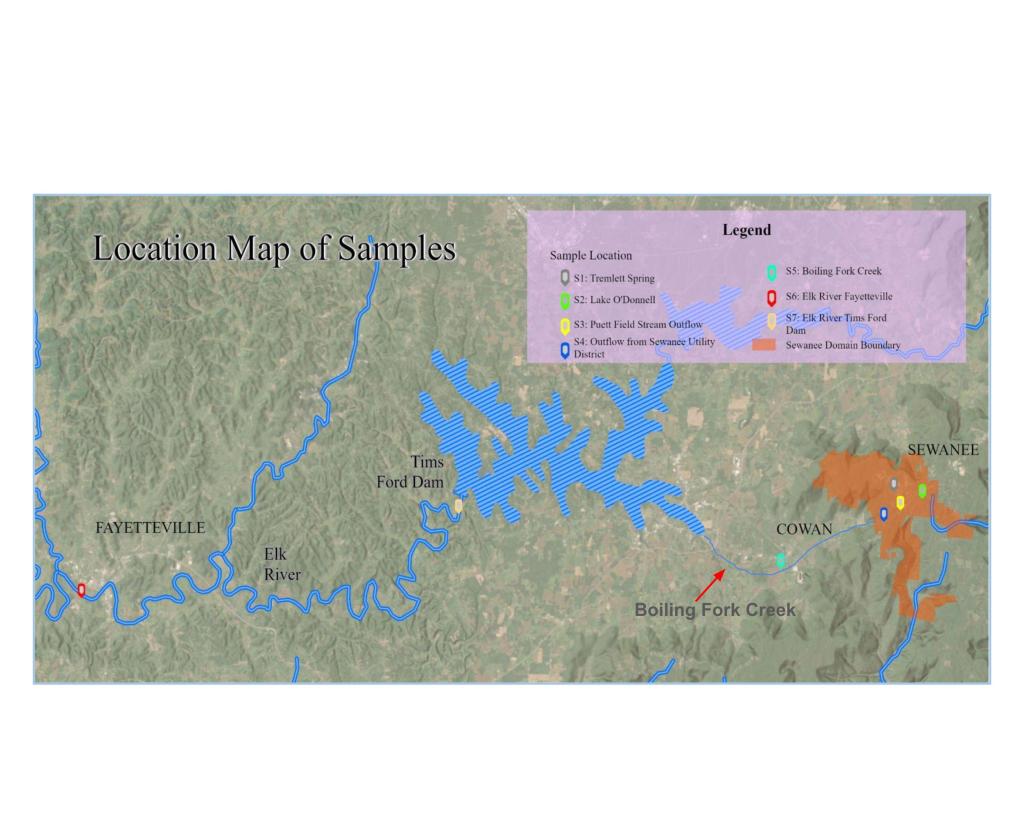
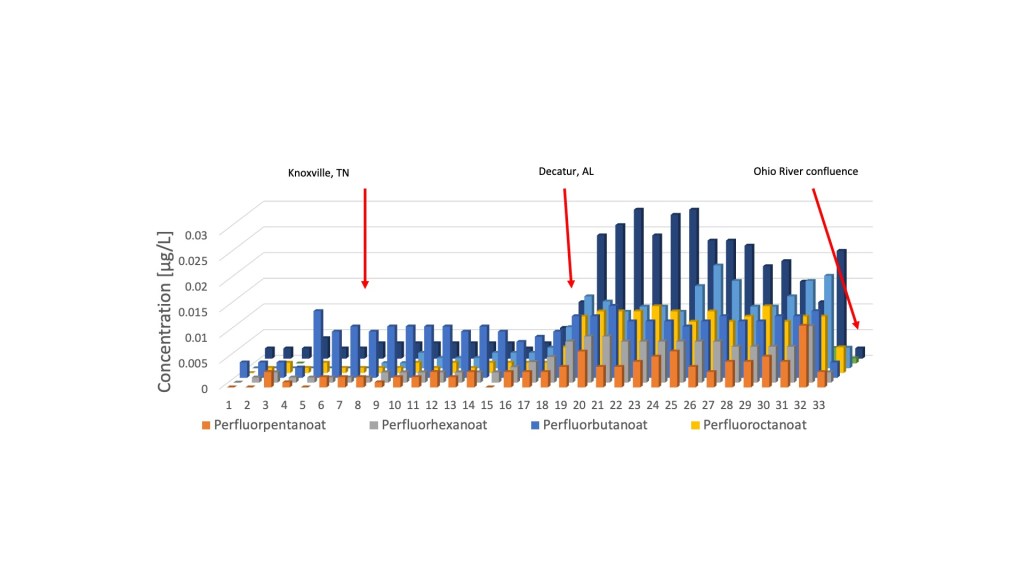
PFAS chemicals have also been found in the Tennessee River watershed and in the Tennessee River itself. I conducted studies of PFAS concentrations in a tributary of the Tennessee River (Boiling Fork Creek/Elk River) in 2025 and along the entire length of the Tennessee River in 2017 as part of the Tenneswim Project. These studies provide an interesting chronicle of PFAS contamination from the rooftop of the Tennessee River watershed through the Tennessee River all the way to its confluence with the Ohio River in Paducah, Kentucky. The tributary sampled was the Boiling Fork Creek, which begins atop the plateau in the town of Sewanee, Tennessee and flows southwest where it enters the 195 -mile long Elk River, which in turn winds its way southwestward to meet the Tennessee River in Alabama. Samples were analyzed for up to 40 different PFAS chemicals in stream water, a lake, a spring, and a stream with treated municipal sewage effluent (see the map with sample locations below). All samples contained some number of PFAS compounds, with select compounds show in the table below. With one exception, the values all along the Boiling Fork and Elk Rivers were below 3.1 ppt and did not show an increase downstream as one might expect. The lone high concentration of 6.8 ppt came from stream water emanating from an artificial turf athletic field. Plastic grass blades from such fields are known to be made with PFAS compounds. The Tennessee River contains similarly low levels of PFAS upstream from Knoxville, but then the levels increase near Knoxville. The Tennessee River PFAS chart shows a large increase in the compounds near Decatur, Alabama where the 3 M manufacturing plant had confessed to previously releasing PFAS into the Tennessee River. The levels remain elevated all the way downstream to Paducah, Kentucky.
PFAS sample locations along the Boiling Fork Creek and Elk River in Tennessee.Samples taken in 2025. Source: Knoll and student research conducted in spring 2025. Unpublished data.
Below are results from analyses of samples that correspond to sampling sites in headwaters of the Boiling Fork Creek, Boiling Fork Creek and the Elk River on the map above. All samples analyzed by a commercial lab using EPA method 1633.
S1: Tremlett Springs PFOA 2.8 ppt
S2: Lake O’Donnell
PFPEA: 3.1 ppt
S3: Puett Field (artificial turf athletic field) Stream Outflow
PFHxS: 6.8 ppt
S4: Outflow from Sewanee Utility District (municipal sewage treatment plant)
PFOS: 2.0 ppt
S5: Boiling Fork Creek
PFOS: 1.2 ppt
S6: Elk River Fayetteville, Tennessee
PFOS: 0.57 ppt
S7: Elk River Tims Ford Dam
PFAS values from the Tennessee River in 2017. Sample 1 is at the start of the River with ascending numbers moving downstream. Note the marked increase in concentrations below Decatur, Alabama. Concentration values on chart range from less than 2 ppt to almost 30 ppt. Source: Research conducted by Fath and Knoll during the Tenneswim Project during the summer of 2017. All samples analyzed by a laboratory in Germany using HPLC/ double mass spectrometer.
Lake Cheston in Sewanee, Tennessee on Nov. 13th, 2016.
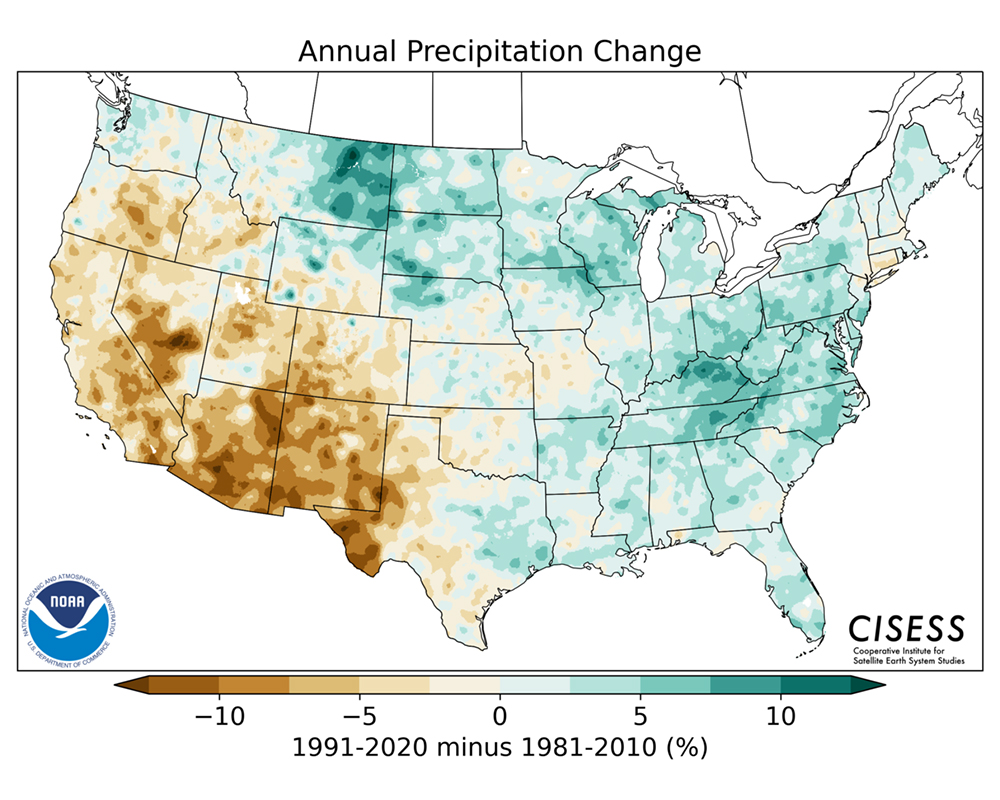
The last two decades have witnessed a significant shift in precipitation patterns across the Cumberland Plateau and middle Tennessee in general. Annual precipitation has continued to increase, a pattern seen in weather records throughout the 20th Century. The National Oceanic and Atmospheric Administration (NOAA) used data from over 7300 weather stations across the country to chronicle precipitation changes from 1991 to 2020. Their results are illustrated in the map below and show a clear increase in precipitation in the middle Tennessee region and Cumberland Plateau.
Annual precipitation change in the US between 1991 and 2020 showing an increase over middle TN and the Cumberland Plateau.
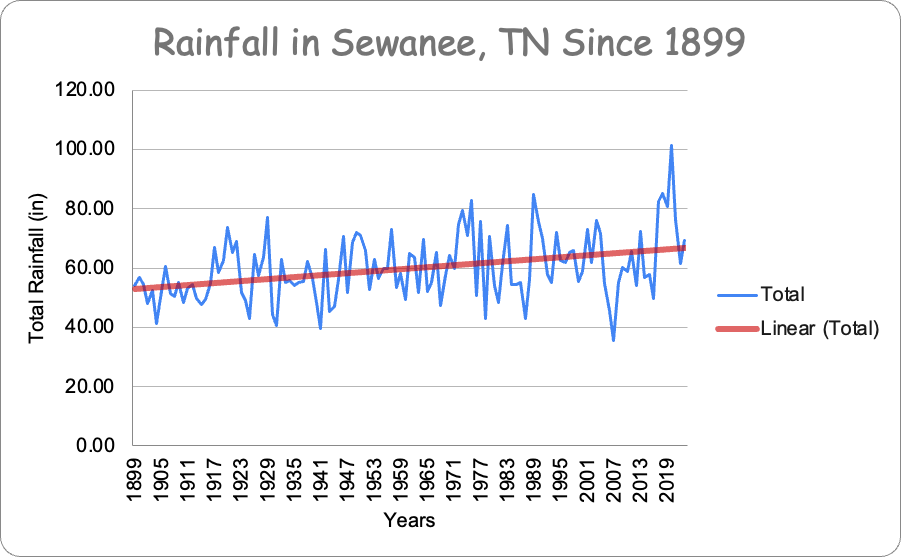
Weather records have been kept in Sewanee, Tennessee since 1899 and show an increase in precipitation through the 20th Century to the present (below).
Annual precipitation in Sewanee, TN since 1899. Red line is the trendline, which shows a steady increase in precipitation to the present. Data compiled by Marion Knoll and her 7th grade students.
It is not just how much it rains annually that is important, but also how the precipitation falls across the year. Weather records show that heavy precipitation events, or downpours, have increased in frequency and intensity in the southeastern United States in the last seventy years. All Tennesseans remember the dreadful flooding in Waverly in 2021, when it rained 21 inches in one day and the resulting floods killed 20 people. In 2010 over 13 inches of rain hit Nashville in two days, resulting in extensive property damage from flooding of the Cumberland River and its tributaries. In neighboring Asheville, North Carolina up to 30 inches of rain caused extensive flood damage in 2024. This increase in downpours holds true for most of the rest of the US and is depicted in NOAA’s map below:
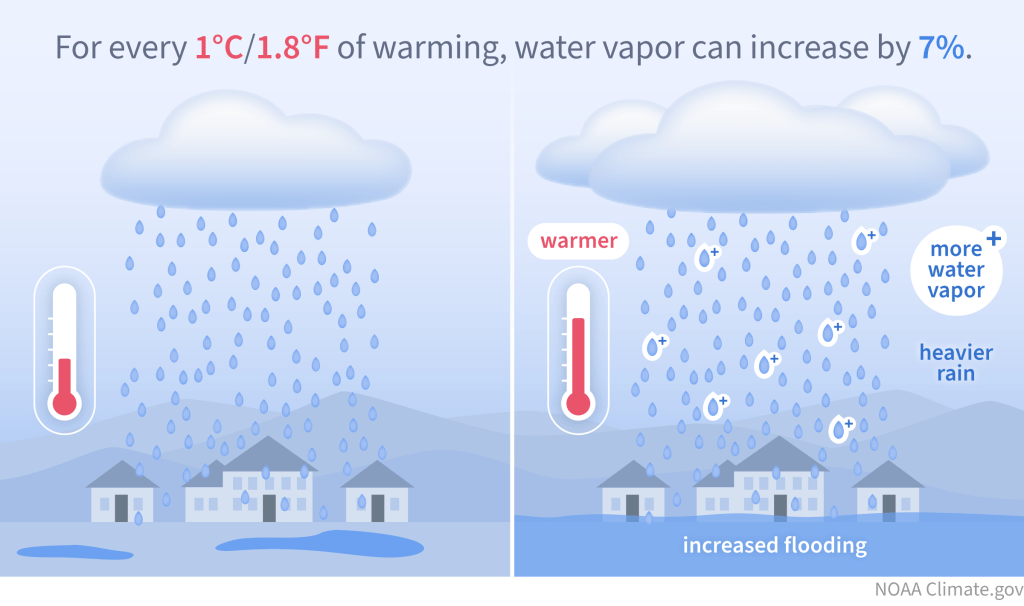
Why is our area getting more rain and why are there more and more heavy downpours? The reason is that the atmosphere over the southeastern US has warmed over the past 100+ years. One of the basic laws of atmospheric physics is that warmer air can hold more moisture than cold air. In fact, for every 1.8° F rise in temperature, the air can hold 7% more moisture.
Increase in atmospheric moisture with increase in air temperature.
Temperature increases in the US between 1991 and 2020. Since 1900, temperature over the southeast has increased by about 2° F.
Since warm air can hold more moisture, this means that the moisture may not be released for some time as rain, resulting in a drought. When the water is released it then often comes down as a downpour, resulting in flooding. Such a back and forth between droughts and downpours is often referred to as “weather whiplash.” Two of the most severe droughts of the last 125 years in Sewanee and the surrounding area have occurred in the last 20 years, specifically in 2007 and 2016. These droughts played havoc with water supply on the Cumberland Plateau, leading to very low reservoir levels, dry wells and infrastructure failures. During the 2007 drought the interstate rest areas in Monteagle (I-24) were closed due to lack of water. Sewanee’s primary drinking reservoir, the 130 million gallon (mg) Lake Jackson, was 34 feet below lake-full levels (the deepest point of the lake is 50 feet). In 2016 Lake Jackson dropped from 15 feet to 20 feet below lake-full levels from October 25th to November 26th.
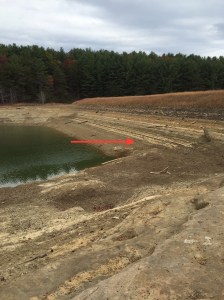
Lake Jackson in Sewanee on Oct. 25th, 2016 at 15 ft. below normal.
Lake Jackson on Nov. 26th, 2016 at 20 ft. below normal. Red arrow shows level on Oct. 25th.
Lake Jackson is part of Sewanee’s reservoir system, which is administered by the Sewanee Utility District (SUD). Its waters are pumped first into the smaller reservoir of Lake O’Donnell (80 mg), before water is treated at a filtration plant and sent on for public consumption. If the drought becomes severe enough and these lakes become critically low, then water can be pumped into Lake Jackson from nearby Lake Dimmick (230 mg).
Sewanee’s reservoir system. Lake Dimmick can be tapped if levels of other lakes become critically low (mg = million gallons).
Since all groundwater is fed by rain, exceptional droughts lead to declines in the water table and in the flow of springs. Tremlett Spring in Abbo’s Alley in Sewanee was flowing at near record low levels of 6264 gallons per day (gpd) in 2016, and 6171 gpd in 2007. For comparison, an average flow rate for the spring during non-drought years is around 12,000 gallons per day.
Although violent downpours may be the joy of water managers, since they tend to effectively fill reservoirs, they can of course result in greater rates of erosion (see post Stormwater on the Plateau) and flooding. In fact, the number of severe flooding events of the summer of 2025 across the US reflect the changing climatic conditions caused by global warming. The July 4 flooding of the Guadalupe River in Texas, the flooding of the Eno River in North Carolina near the same time, the generational flooding in Chicago and the fire-scar-enhanced flooding in Ruidoso, New Mexico are all a testament to our changing climate.
The mountains of eastern Tennessee form the rooftop of the Tennessee River watershed. This is the highest ground upon which rainwater falls, ultimately making its way down to the river. The town of Sewanee is on that part of the rooftop known as the Cumberland Plateau. Water falling here has only one desire – to move downhill.
The sublime ease of living at the top of a watershed.
And the journey off the rooftop is a quick one, provided water molecules aren’t caught by thirsty tree roots and evaporated back into the sky. It is estimated that the forests on the Plateau can catch and transpire up to 75% of rain that falls during summer months, thereby creating more clouds and afternoon thunderstorms. The dense sandstones of the plateau make the mountain flat-topped and prevent most water from infiltrating the ground. The water is quickly whisked along small creeks, finally jumping and skipping over cliffs that line the Plateau’s edge.
Water leaving the Cumberland Plateau.
After a brief journey down the steep upper slopes of the Plateau, the water now plunges deep into caverns and passageways of rock formed in the limestones of the lower reaches of the Plateau. The water has changed chemically and physically. When it first made its way across the Plateau top it was little-altered chemically, save for excess silicon picked up from the quartz grains in the sandstone. Its pH also remained like that of the rain, slight acidic with values around 4 to 5. The journey through limestone caverns has raised its pH to around 8 and large amounts of calcium and magnesium have been released into the water from the dissolving limestones.
Water making its way through the limestone of Bridal Veil Falls near Sewanee.
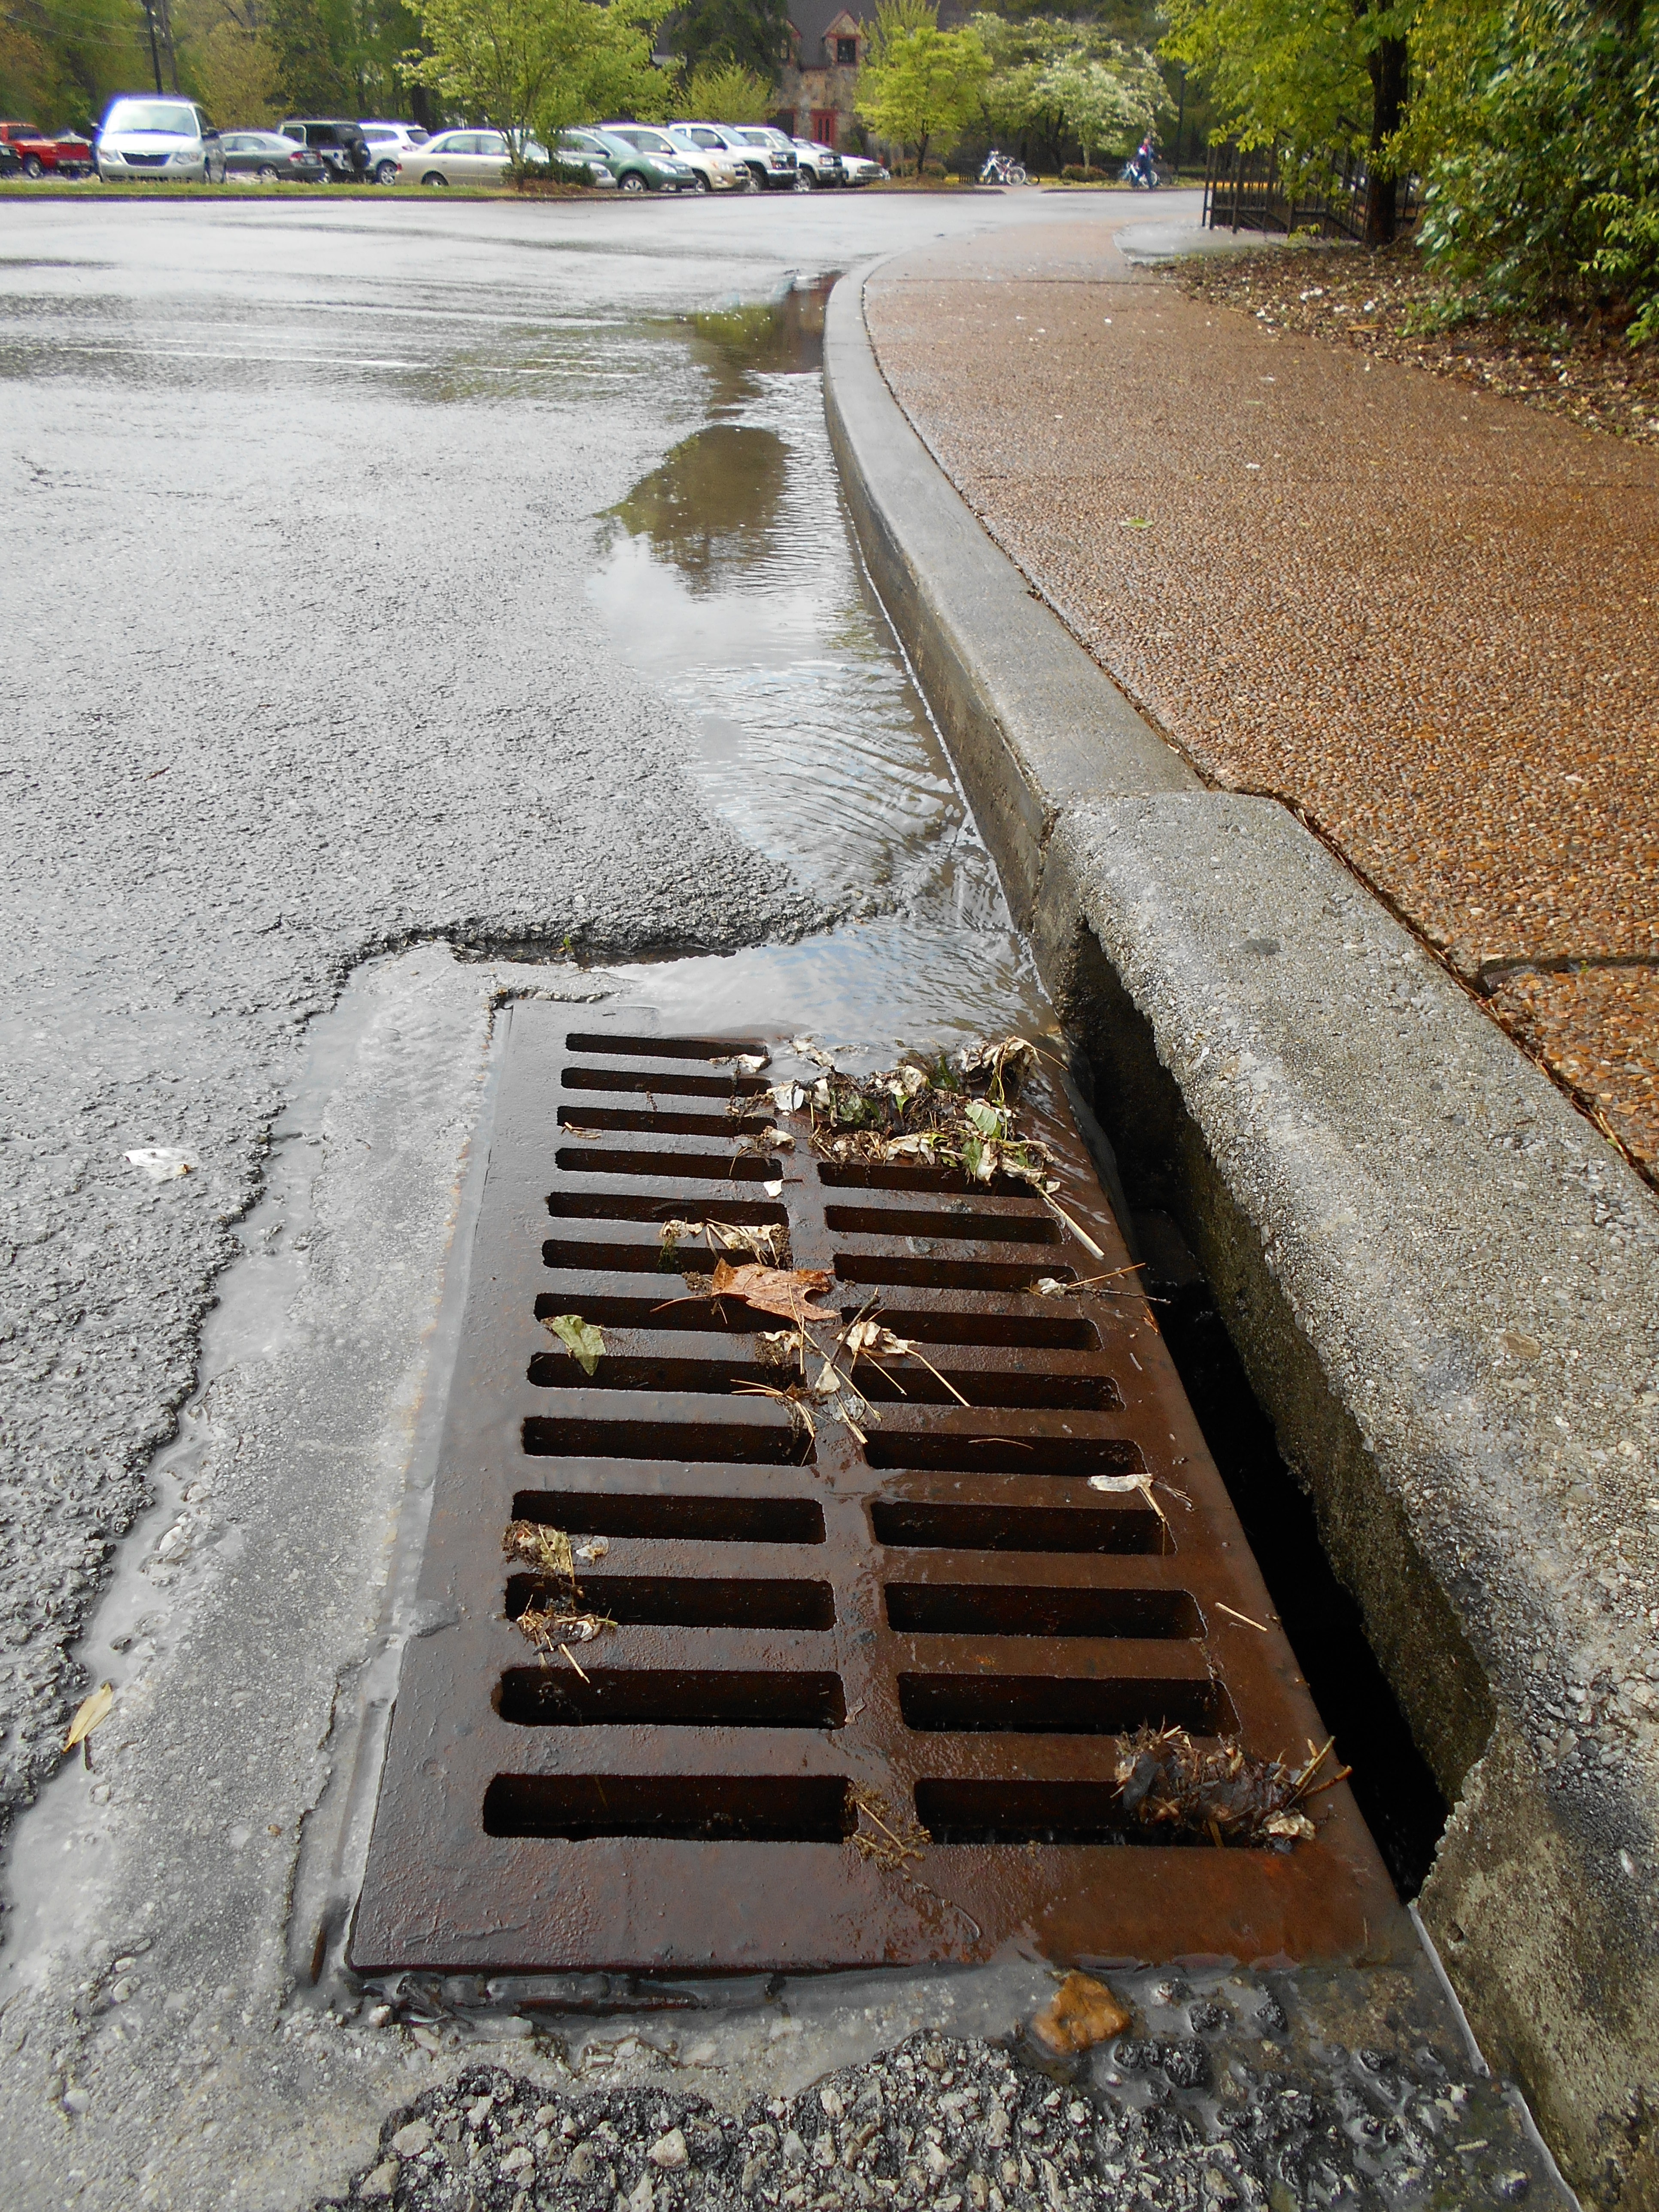
Towns atop the Plateau also change the chemistry of the water. Winter road salting increases sodium. Rain washing through metal gutters and across automobiles picks up excess copper, lead, nickel, aluminum and other metals. Overloaded streams leaving the hardscape of roads, parking lots and roofs run more turbid than their counterparts in forested ecosystems, having picked up larger quantities of silt and clay. These surfaces also contribute oil, bacteria, grease, litter and plastics of all sizes – even the microscopic. Effluent from sewage treatment plants add their bit to the chemistry of streams through pharmaceuticals, hormones, nitrates and phosphates.
Silty urban runoff during a storm.
Many of these contaminants will make their way all the way down to the Tennessee River via tributaries like the Elk and Duck Rivers. There is a sublime ease in living on a rooftop, unaffected by pollutants found further downstream, but our actions here impact the quality of water others drink downhill. The chemical character of a river is given to it by the sum of what goes on in its watershed.
Wendell Berry once said:
“Do unto those downstream as you would have those upstream do unto you.”
Once a part of the Domain (campus) of the University of the South in Sewanee, Tennessee, the Sewanee Natural Bridge was given to the Tennessee Conservation Department in 1976 and is now part of the newly created Head of the Crow State Park. At more than 100 feet long and 25 feet high this bridge illustrates the interplay between water and rock structure in the development of a relatively seldom seen feature along the edge of the Cumberland Plateau.
The bridge is the result of erosion by ground water and surface water along vertical joints (geology-speak for cracks) and horizontal partings in the rock. The rock is the Warren Point Sandstone, which forms the prominent cliffs all along the Cumberland Plateau in this area. Formed over 300 million years ago and buried deeply by other rock layers the Warren Point, along with other layers of the Cumberland Plateau, has experienced uplift over the last 5 million years or so. This uplift has lead to the removal by erosion of thousands of feet of rock that once lay atop this layer. This uncovering of the Warren Point released vast amounts of pressure caused by the weight of the overlying rock. The release in pressure in turn caused the Warren Point to expand and crack along a series of vertical, parallel joints. These joints were natural conduits for the downward flow of rain water, which resulted in the gradual wearing away of the rock along the joints.
Aerial view of vertical joints in sandstone in Canyonlands National Park. Notice that there are 2 sets of joints at high angles to one another. Photo by Haakon Fossen.
The rock in today’s bridge represents the rock between 2 joints that was more resistant to erosion than the surrounding rock. That explains the origin of the thin band of rock in the bridge, but how did the empty space under the bridge form? A powerful clue is found at the base of the main cliff face just uphill from the bridge. Here a spring once flowed with more vigor from a horizontal parting in the sandstone. This groundwater eroded away the rock beneath the bridge. This process does NOT involve sinkhole formation, as is erroneously stated in multiple on-line descriptions.
Small overhang with spring from which water originated that eroded out rock under the bridge.
What the bridge may have looked like in its early stages of formation is hinted at by another nearby location, Widow’s Crack, where a younger natural bridge is forming. Here there is still an active spring eroding away the sandstone under the incipient bridge.
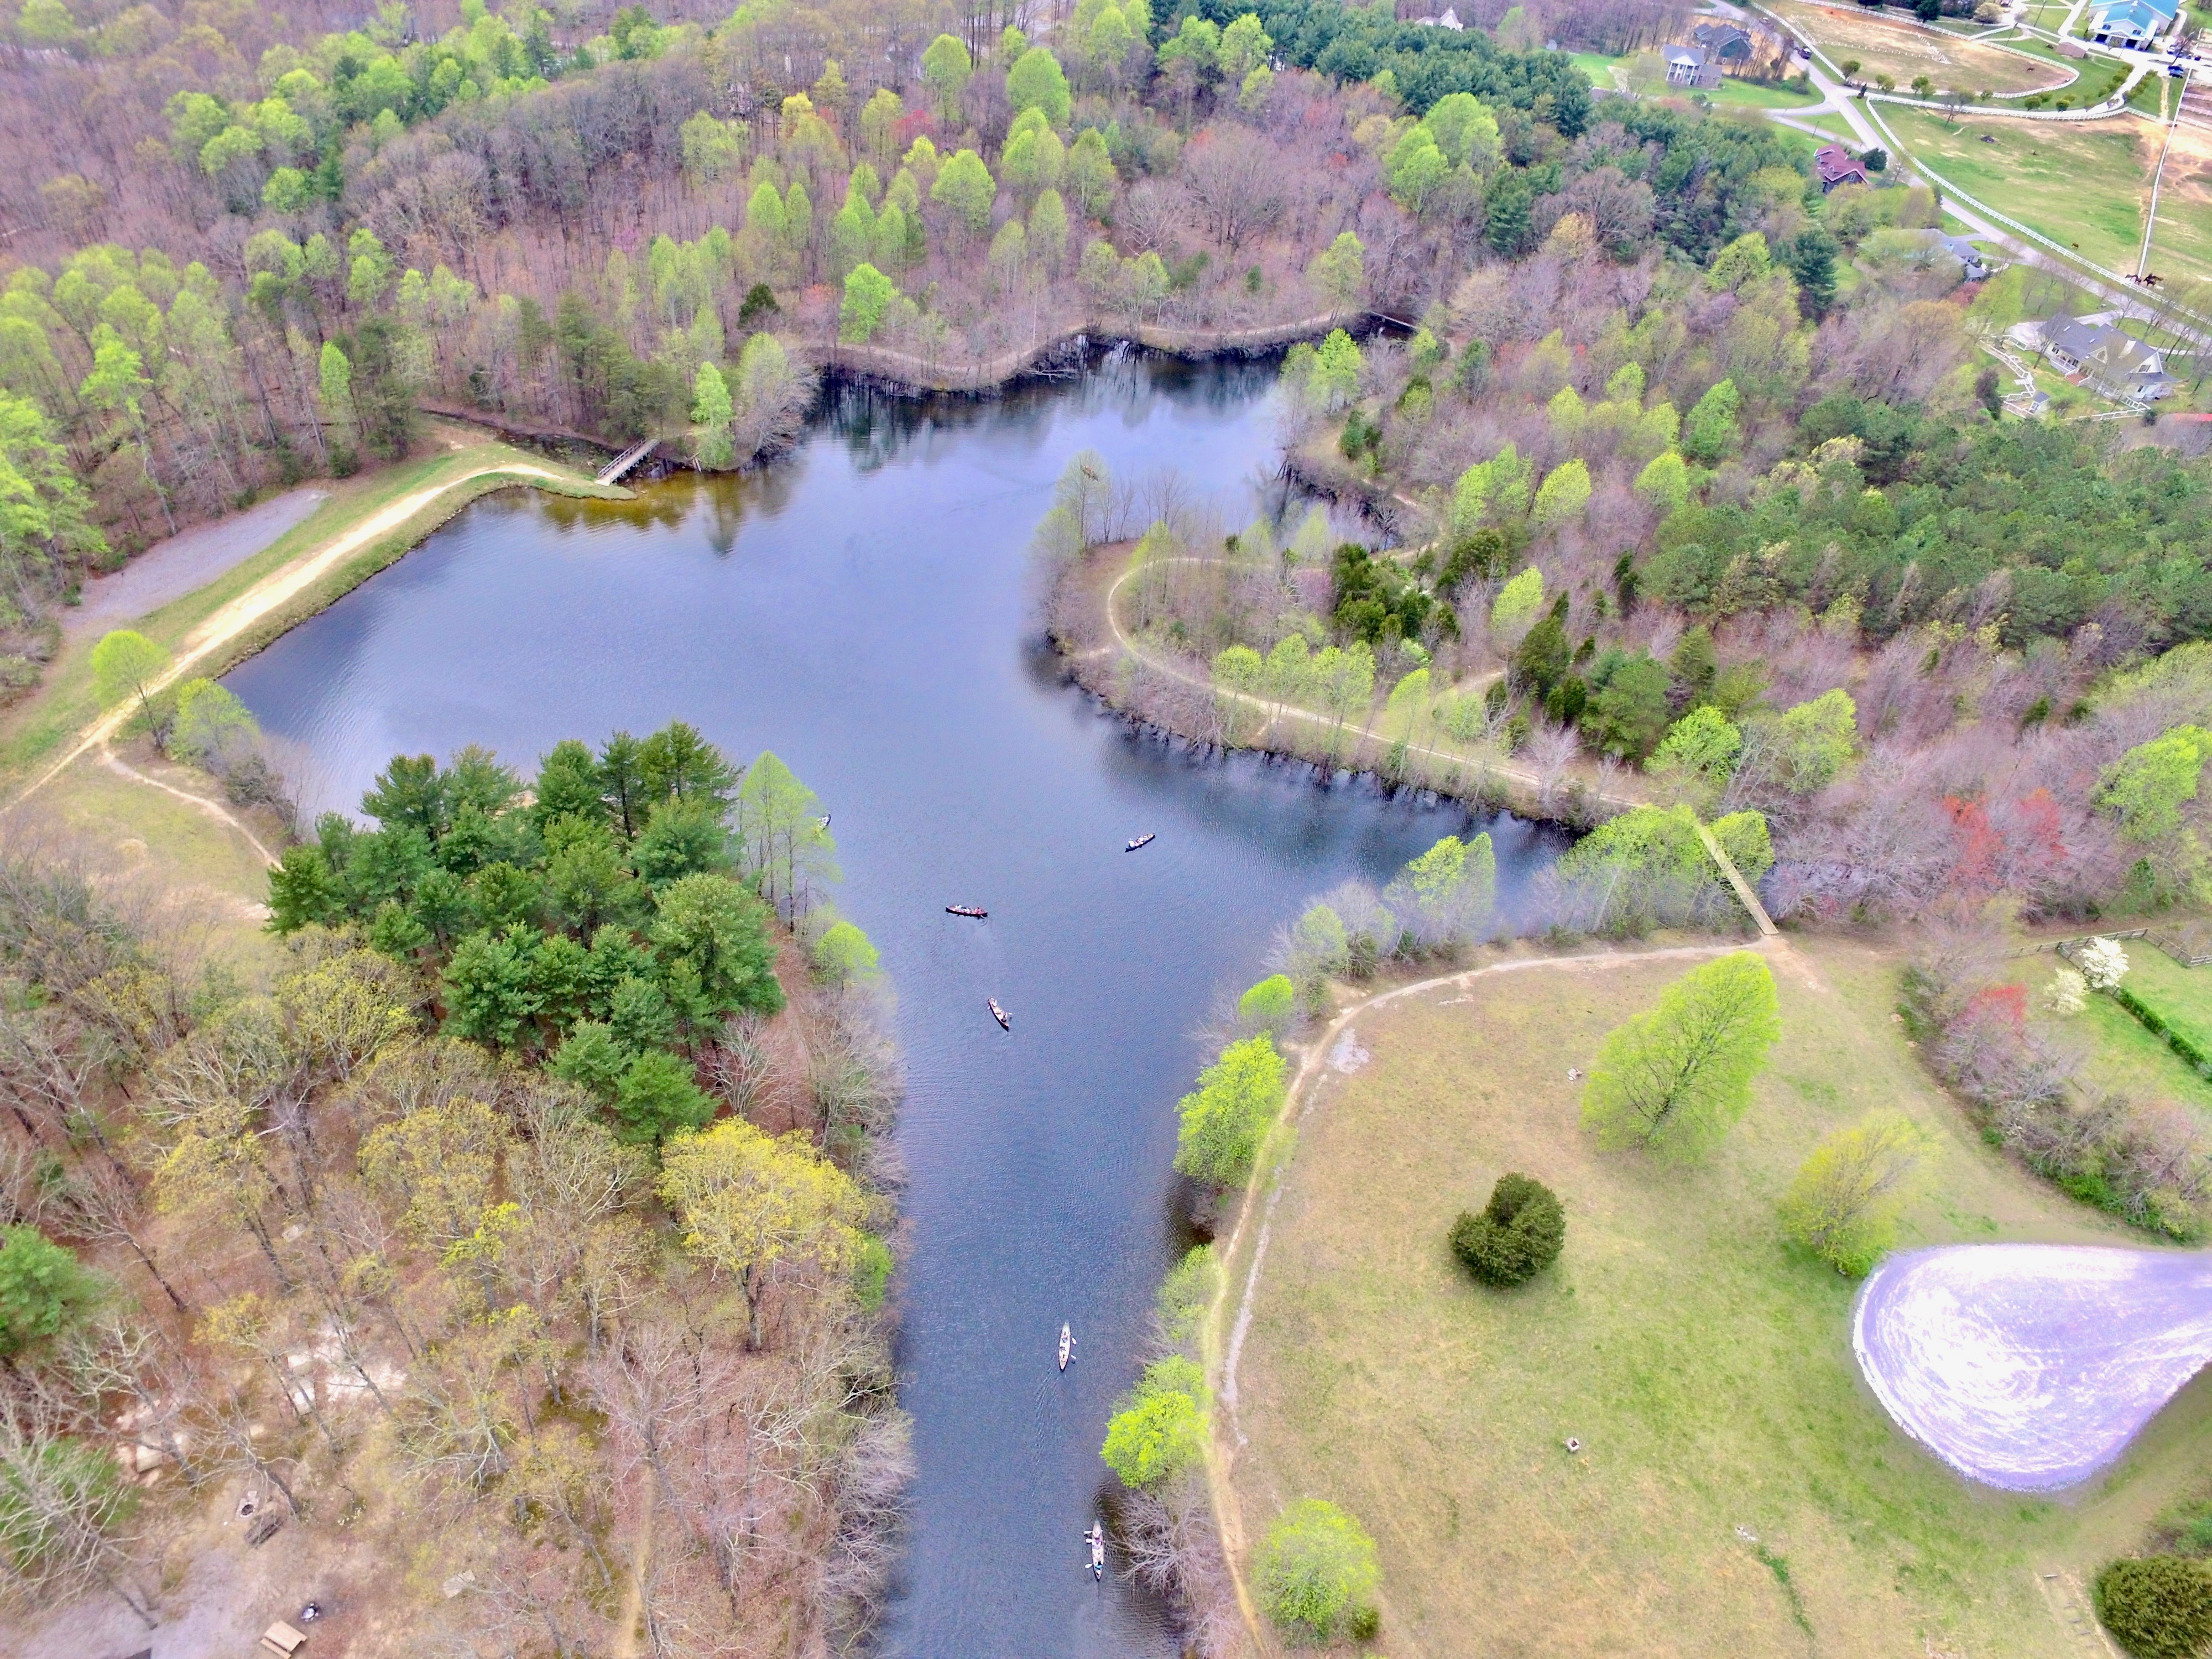
Fig. 1. Lake Cheston, a small, 7-acre man-made lake atop the Cumberland Plateau in Sewanee, TN. Dr. Martin Knoll’s hydrology class seen collecting data from canoes. Photo by Clark Lupton.
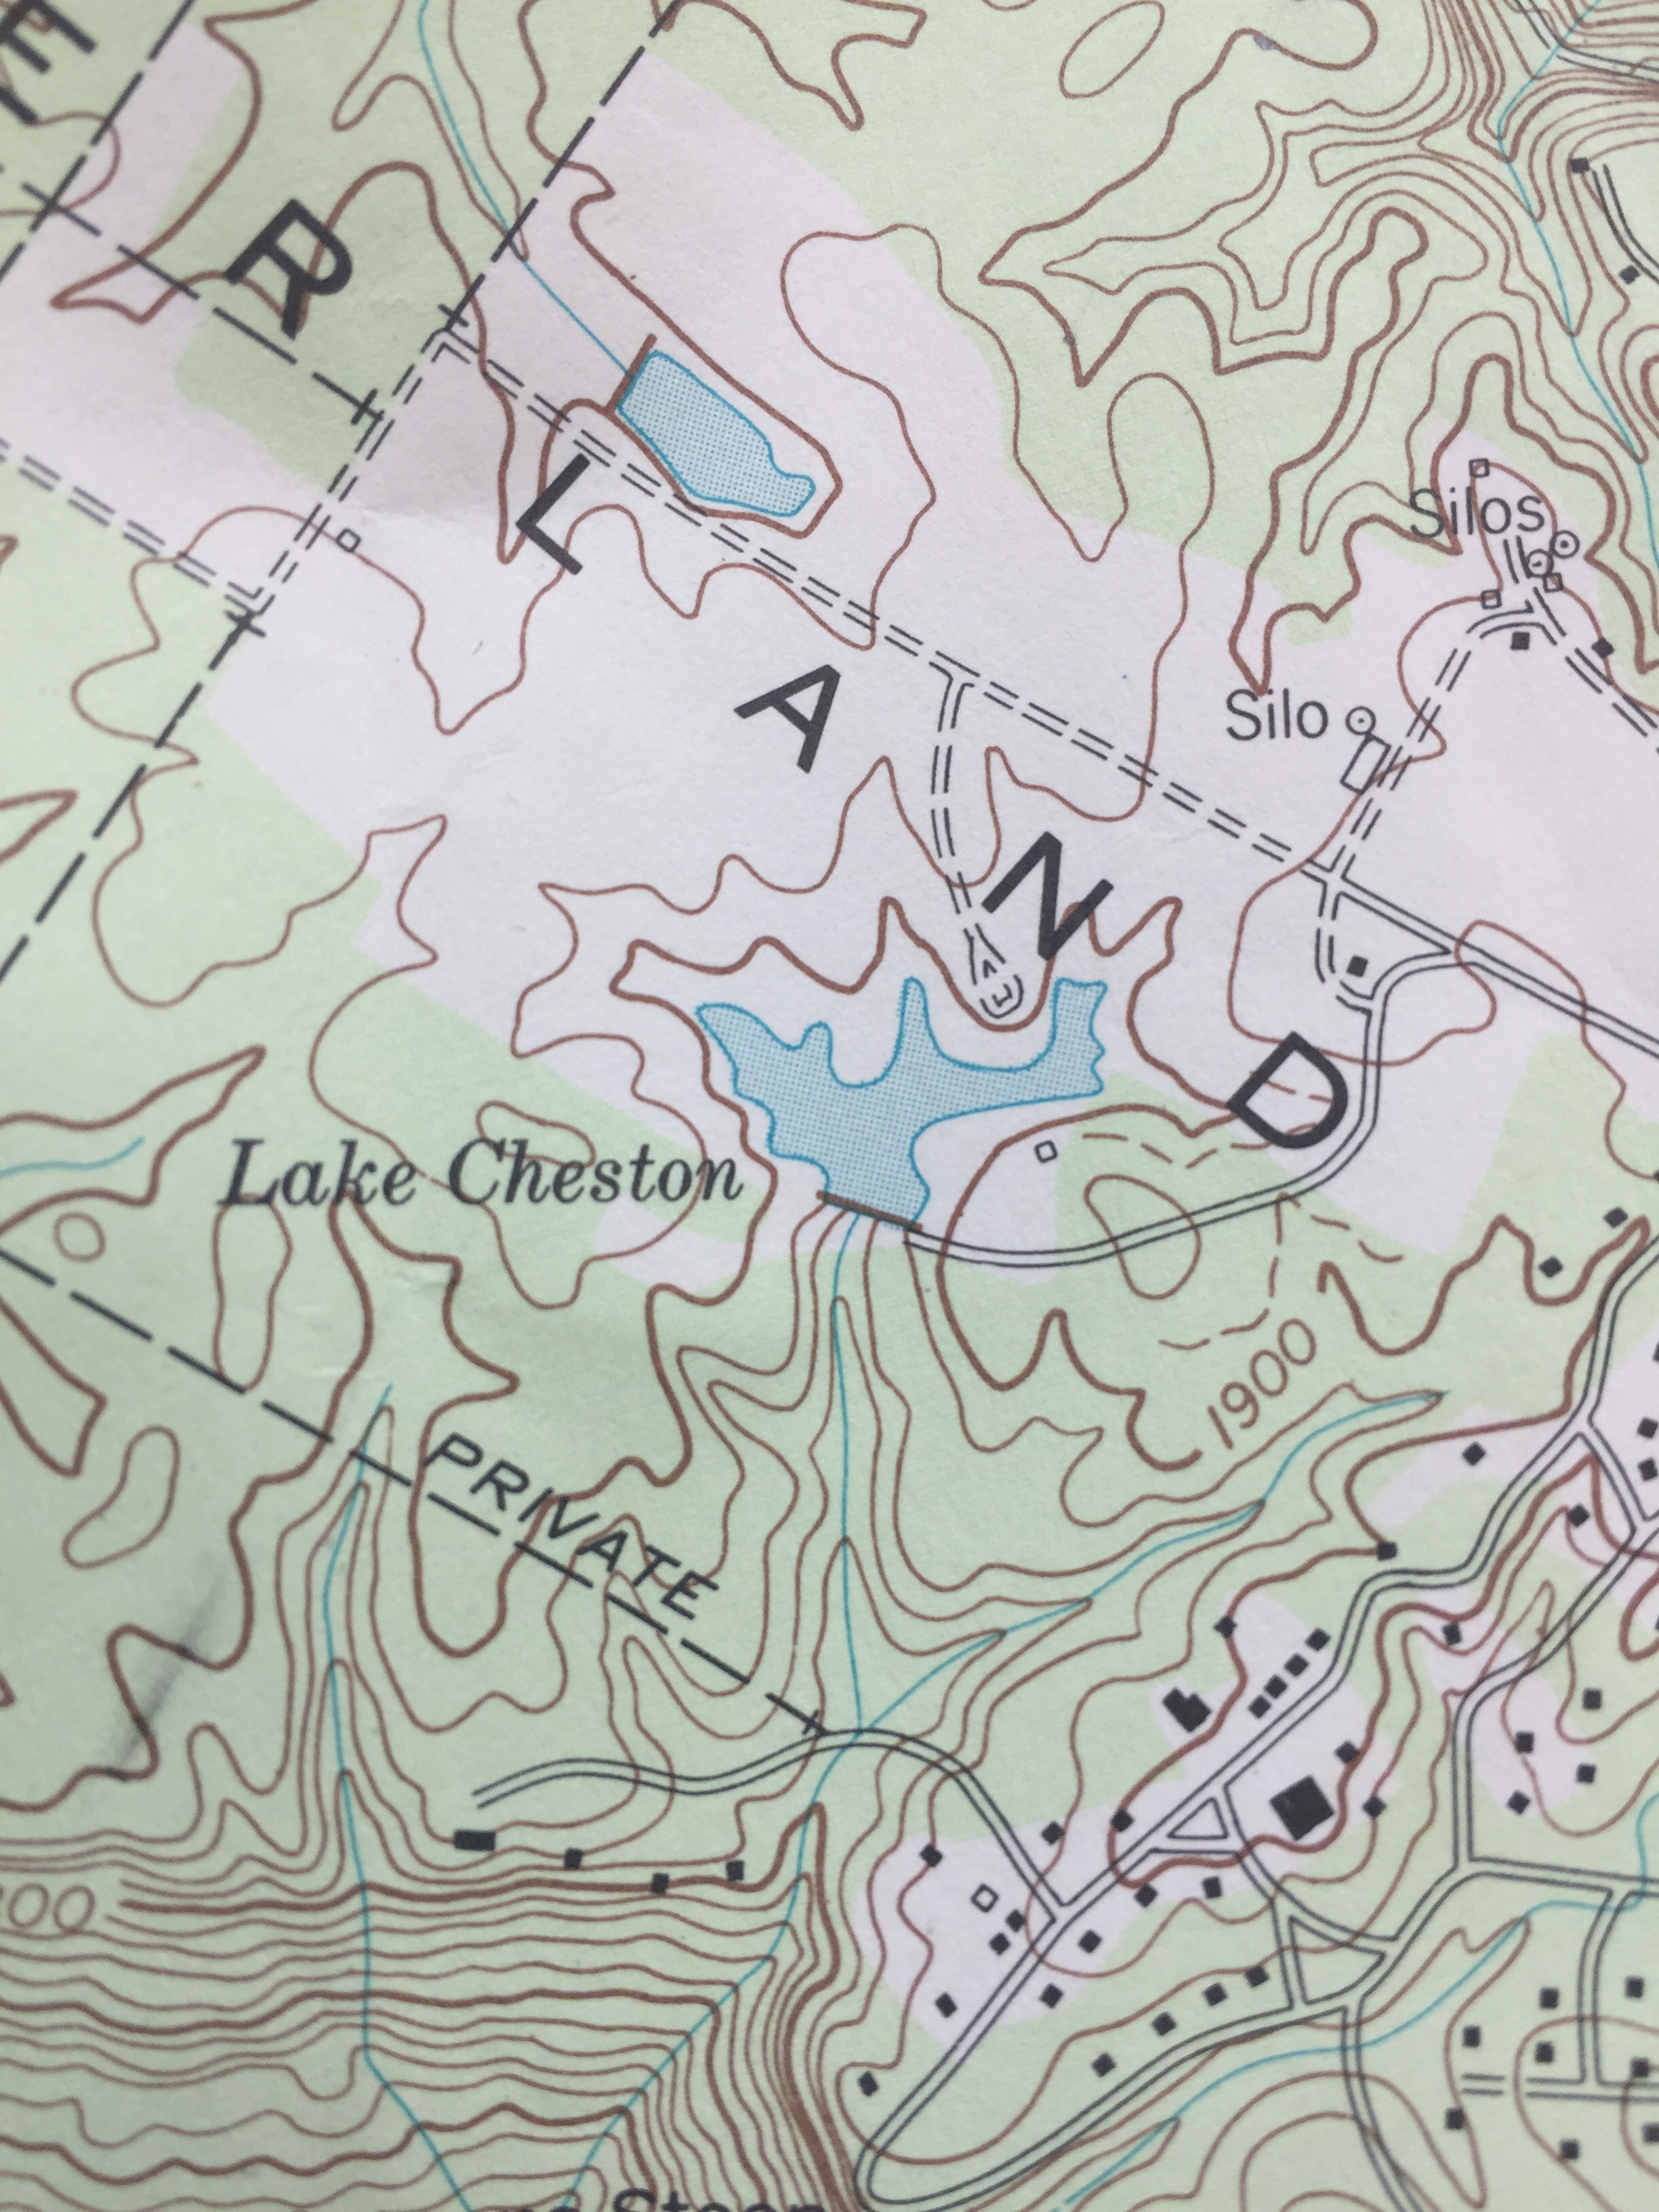
There is only one natural lake in all of Tennessee. Reelfoot Lake in northwest Tennessee was formed by ground subsidence during a series of great earthquakes in 1811/12. All other lakes in the state, including the many dozens on the Cumberland Plateau, are man-made. A quick look at a topographic map or Google Earth image reveals the origins of these lakes. The lakes all have a long, straight edge along part of their shore – a dam (Fig. 2). Lakes on the Plateau tend to be small, especially compared to larger impoundments on the Tennessee River and its tributaries. Lake Cheston in Sewanee, Tennessee is a good example of a typical lake on the Plateau (Figs. 1 & 2).
Fig. 2. A topographic map of a portion of Sewanee, TN. Notice the dams on the southern end of Lake Cheston and the northwestern side of the smaller Farm Pond.
Even the smallest of Plateau lakes show seasonal fluctuations in chemical and physical properties seen in larger lakes across the temperate zones of the world. As air temperature and solar radiation change through the seasons, lakes go through annual cycles of stratification and mixing.
Summer Stratification
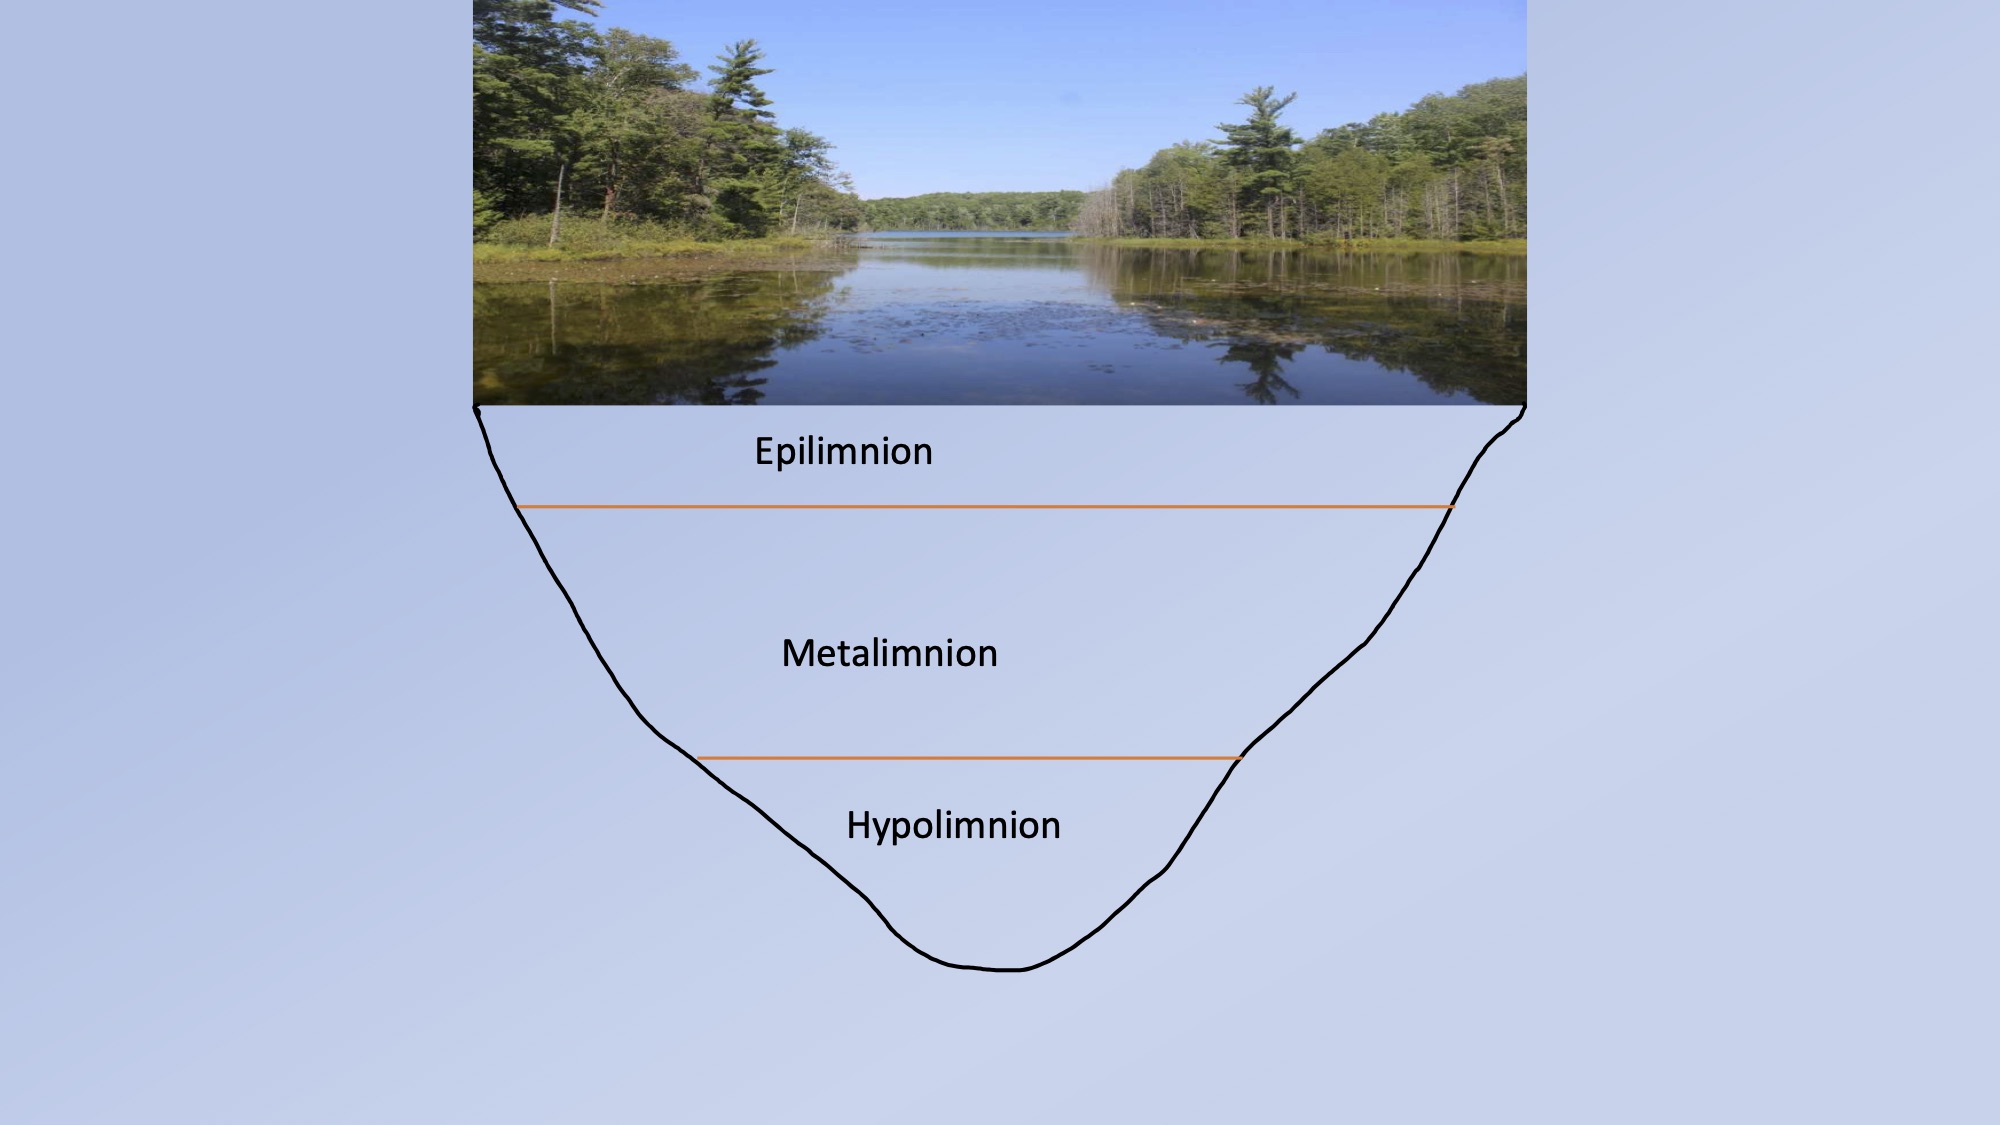
During the summer months the maximum amount of solar radiation beams down upon a lake, warming its waters to a depth of several feet. The summer air above the lake also warms the upper lake portion. Wind blowing across the lake surface mixes the upper lake so that there is a relatively uniform temperature found to a depth of about 6 to 8ft. This layer is referred to as the epilimnion (Fig. 3).
Fig. 3. The three layers found within a temperate lake during the summer months. The layers can be best detected by trends in temperature and dissolved oxygen with depth.
The density of water increases as it gets colder, until a temperature of 4 degrees C is reached. At this point water begins to expand again, becoming less dense. For a lake in summer, this means that the warmest, least dense water will be near the surface (epilimnion) while the coldest, densest water will be at the bottom. This bottom layer is uniformly cold and has no currents to mix it. It is called the hypolimnion. Below the epilimnion and out of reach of the warming effects of the sun and air, the temperature rapidly decreases with increasing depth. This zone is called the metalimnion. Swimmers that drive their toes below a depth of 6-8 ft will feel the distinct cooling within the upper parts of the metalimnion (Figs. 3 and 4).
Fig. 4. Temperature-depth profiles for Lake Cheston in the summer (pink line) and winter. Summer stratification is evident, while the winter profile shows destruction of stratification by fall turnover.
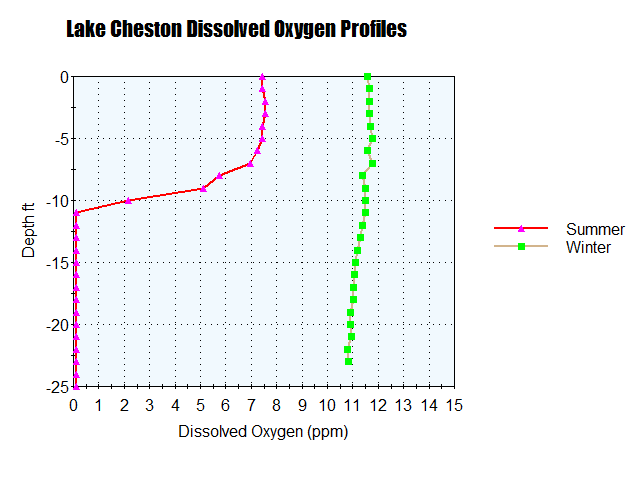
Because the epilimnion is well mixed by wind, oxygen from the atmosphere has also been dissolved throughout this uppermost lake level. In fact, the epilimnion can often be detected by uniformly high levels of dissolved oxygen (DO) in the upper 6-8 ft of the lake (Fig. 5).
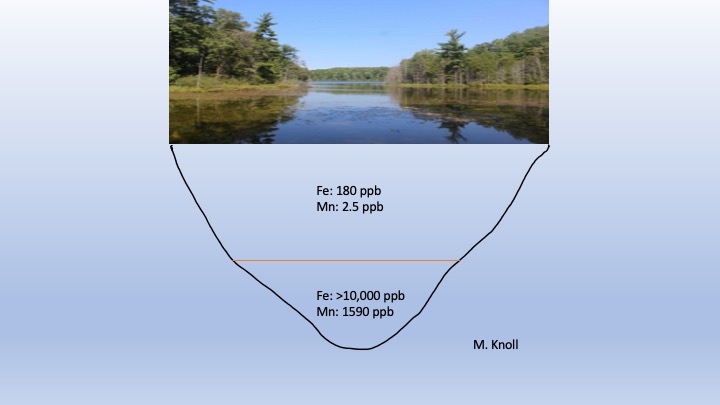
Along with summer stratification by temperature and DO, there is also stratification based on chemistry in many Plateau lakes. The upper rock layers of the Plateau upon which the lakes are built are made up of sandstones, conglomerates and shales. These contain high amounts of iron (Fe)- and manganese (Mn)- bearing minerals (see previous post titled “Why we’ve pulled the plug on well water on the Cumberland Plateau”). These elements are continuously released by weathering and enter lake waters. In the summer the waters beneath the epilimnion contain little to no DO (Fig. 5). This means that the Fe and Mn can remain suspended within this low-oxygen layer. In the epilimnion there is enough DO to cause the Fe and Mn to oxidize, form a solid and settle to the lake floor. Summer concentrations of Fe and Mn in the hypolimnion typically exceed 10,000 parts per billion (ppb) and 1500 ppb, respectively. In contrast, surface concentrations are normally near 150 ppb Fe and <10 ppb Mn (Fig. 6).
Fig. 5. Graph showing relationship between dissolved oxygen and depth for summer and winter in Lake Cheston. The epilimnion can clearly be seen in the summer profile. ppm = parts per million.
Fig. 6. Diagram showing summer stratification by chemistry in Lake Cheston. The low DO levels in the hypolimnion lead to highly elevated levels of suspended Fe and Mn (ppb = parts per billion).
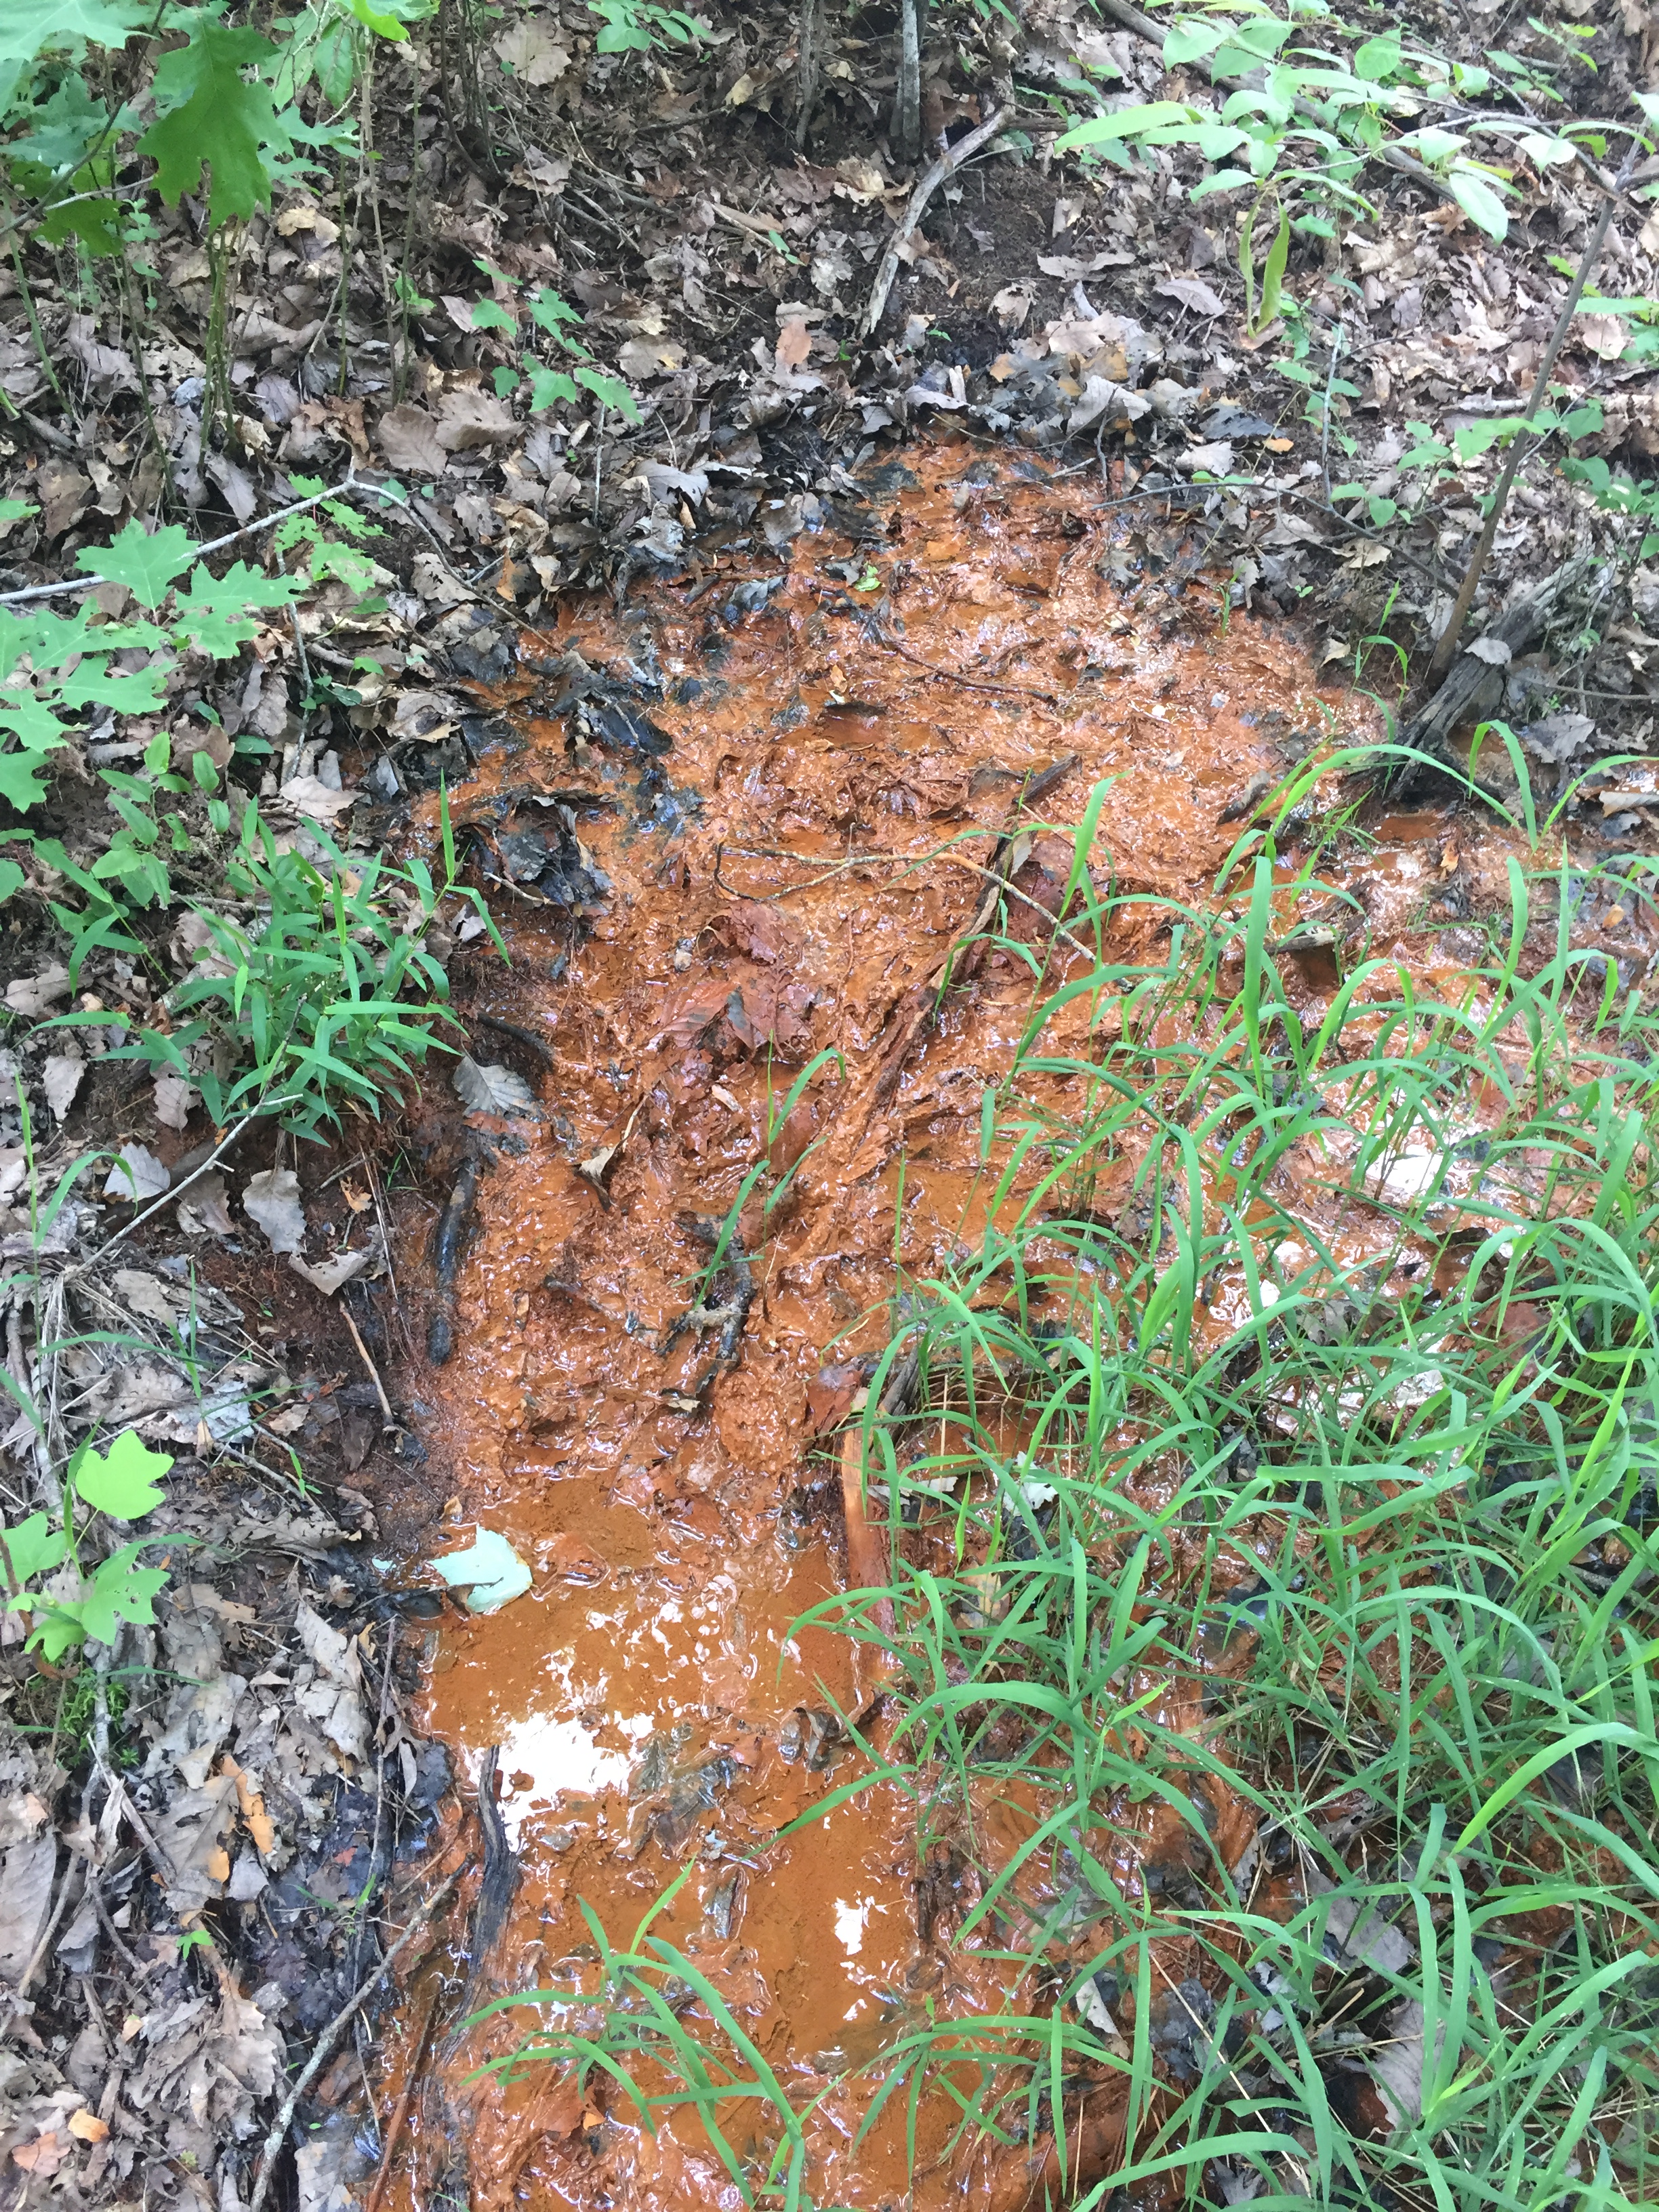
Most lakes have some leakage of bottom waters from the base of their dams. As this oxygen-deprived water is exposed to the atmosphere upon leaving the dam base, the Fe and Mn oxidize through the aid of Fe- and Mn – depositing bacteria and precipitate as a red solid on stream floors (Fig. 7). In the early 2000s, the Tennessee Department of Environment and Conservation (TDEC) became concerned that leakage from Plateau dams would bring high levels of the metals far downstream into watersheds, compromising water quality there. Thus they instituted a temporary moratorium on Plateau lake construction. Research I conducted with students showed, however, that stream Fe and Mn concentrations reached normal levels at around 3000 ft downstream of dams.
Fig. 7. Fe and Mn precipitated by bacteria at the base of Brushy Lake dam in Sewanee, TN. Levels of these metals typically return to normal around 3,000 ft downstream of dams.
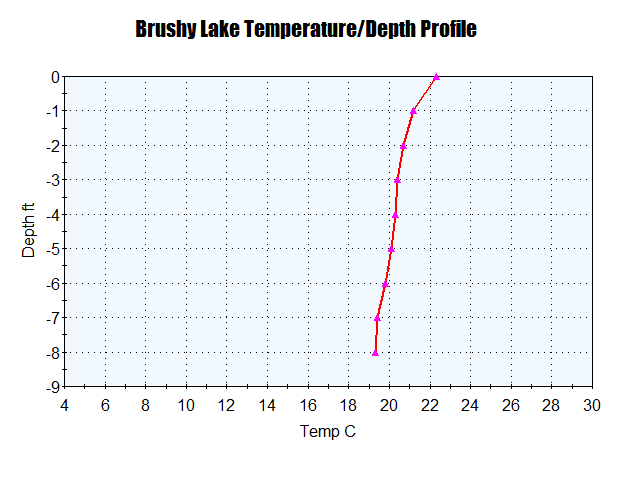
Some lakes are very shallow and therefore don’t have the range of temperatures to support a fully stratified water body in summer. Brushy Lake in Sewanee is only 8 ft deep and therefore has warm water from surface to base (an epilimnion) (Figs. 8 & 9).
Fig. 8. Brushy Lake, an 8 ft deep impoundment in Sewanee, TN.
Fig. 9. Summer Temperature/Depth profile for Brushy Lake, showing an epilimnion that extends to the lake floor.
Fall Turnover
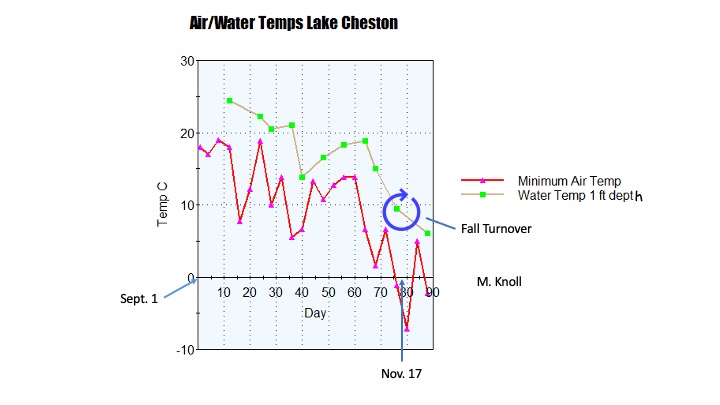
During the fall the drop in air temperature and decrease in solar radiation lead to a cooling of the uppermost lake layer. This in turn means that surface waters become more dense than the waters at greater depth. This instability, with the aid of fall winds pushing surface waters to one side of the lake, results in the upper layer of water dropping to the bottom of the lake in what is termed fall turnover. This mixing of the lake destroys the summer stratification and the lake takes on its typical winter profile, with relatively constant temperatures from surface to bottom (Fig. 4).
Fig. 10. Graph showing relationship between air temperature and surface water temperature in Lake Cheston through the fall.
The diagram above (Fig. 10) shows how decreasing air temperature in the fall causes a decrease in surface water temperature of Lake Cheston, culminating in fall turnover sometime around November 17th. After turnover the lake has a uniform distribution of dissolved oxygen (DO) from surface to bottom (Fig. 5). Notice in the dissolved oxygen graph that winter values of DO are higher overall than in summer. This is because cold water can hold more DO than warm water. Chemical stratification is also destroyed by turnover, with more or less equal values of Fe/Mn throughout the vertical extent of the lake during winter.
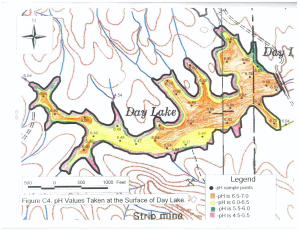
Another interesting pattern seen in Plateau-top lakes is zoning by pH. In Sewanee’s Lake Dimmick (also called Day Lake) in 2004, seniors in the Department of Forestry and Geology collected extensive pH data in the surface waters of the lake (Fig. 11).
Fig. 11. Lake Dimmick (Day Lake) in Sewane, TN, showing a “bathtub ring” of low pH values around its edge.
Notice that the lowest pH values form a “bathtub ring” around the edge of the lake. Rain water in the region typically has pH values between 4.5 and 5. The same values are also found in the soils that cover the Plateau. Thus precipitation falling in the lake’s watershed makes its way into the lake beneath the ground surface as groundwater flow all along the lake shore, with the original pH values essentially unchanged.
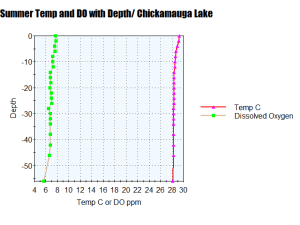
It is interesting to compare Plateau lakes to other lakes in the region. For example, is summer stratification similar in the large lakes of the Tennessee River? Below is a graph showing August values of temperature and DO near the dam in Chickamauga Lake near Chattanooga, Tennessee.
Fig. 12. Temperature and DO trends in Chickamauga Lake in early August.
Notice that the lake lacks the typical summer stratification of temperate zone lakes, with relatively uniform temperature and DO values to a depth of 56 ft. This is because the Tennessee River still flows through its impoundments. Stream flow is turbulent and results in mixing of waters. Thus, while Chickamauga Lake has the appearance of a large lake, the system is still a river with significant mixing.
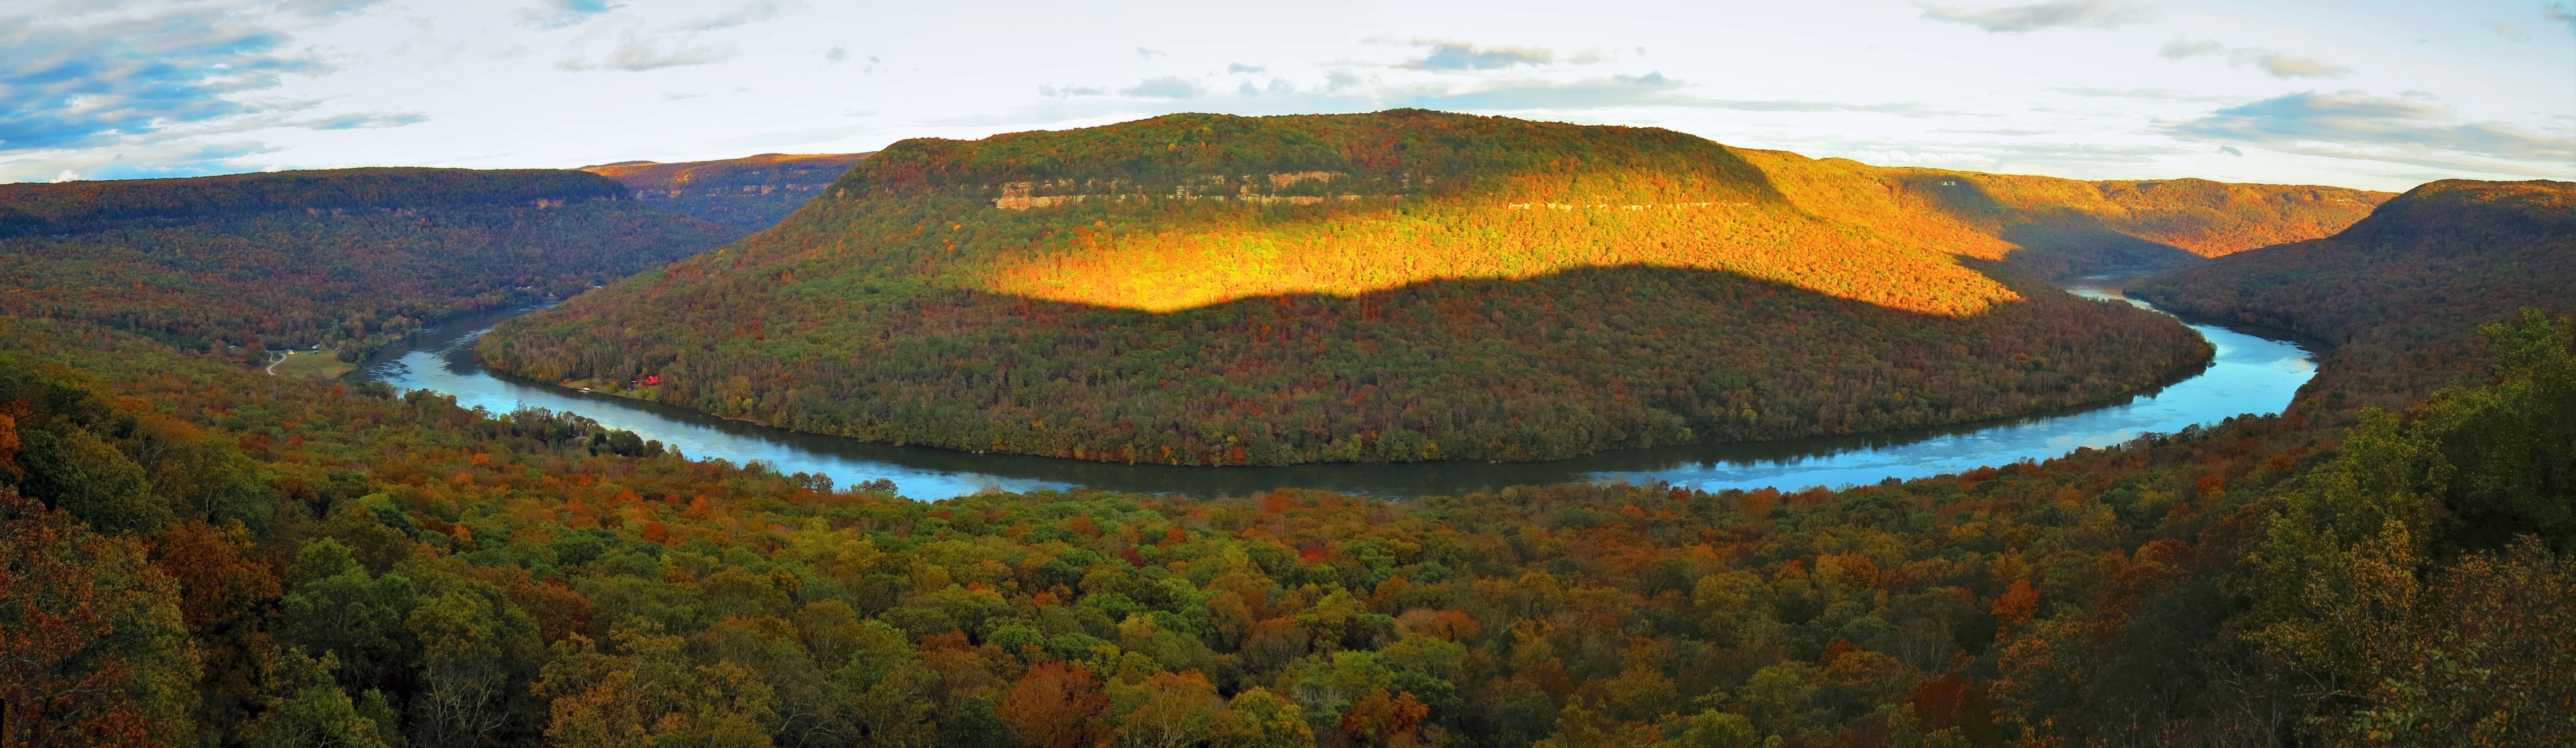
Andreas has been swimming with only occasional breaks for three hours. I try my best to guide him by keeping my kayak just ahead and to the left in his field of view. With each alternate breath he sees my boat. Between breaths he can just see his fingertips in the pea-green water of the Tennessee River as they execute another freestyle stroke. Except for a woman off to our left, we have separated ourselves from the pack of about one hundred swimmers taking part in this ten mile race. My job is easier. I have time to admire the ranks of trees blanketing the steep slopes to either side of us, the Turkey Vultures scribing circles in the sky high above, and the illuminated sandstone cliffs that form the upper cap of the Cumberland Plateau hundreds of feet above us.
I also have time to think about our swim of the entire 652-mile length of the river last year and the immense amount of water quality data we accumulated then. As it turns out the Tennessee is a fairly clean river. Its levels of pharmaceuticals are lower than what is found in the Rhine River. The heavy metals are low. The nitrates and phosphates are acceptable for a river flanked by extensive fertilizer-dependent agricultural areas. There was one big surprise, however – microplastics. These are pieces of plastic less than 5 mm in diameter that are either the broken down bits of larger plastic or small manufactured beads that are used in some toothpastes and soaps for their abrasive qualities. We analyzed for plastics by pumping 1000 liters of water (same as one cubic meter) through a filter that caught particles in the range of 0.025 mm to 0.5 mm. When we analyzed the first river sample we were so startled by the results that we analyzed it again. What we found was a staggering number: over 17,000 particles per cubic meter. This is the highest concentration of plastic particles ever detected in any river. Looking at the exact same size range a few years earlier in Europe’s Rhine River, Andreas only found 200 particles per cubic meter. The Rhine has ten times as many people living in its watershed compared to the Tennessee. How is this possible?
An answer may lie with another analysis we conducted that looked at the type of plastic found in our samples. Below is a diagram that shows the exact number of each plastic type found in Pickwick Lake, one of the nine reservoirs along the river:
Types of plastic particles found in a representative sample from Pickwick Lake. PE=polyethylene, PP=polypropylene, PA=polyamide.
This chart shows that almost half of the plastic found was polyethylene. Most polyethylene is used in light weight packaging and plastic grocery bags. The plastic wrap around produce and the plastic bag it is put into at the checkout counter are likely of this plastic. But how did all this polyethylene get into the river? Although we don’t know for certain, it is highly likely that the majority of it is derived from litter. The samples taken along the length of the Tennessee show roughly the same number of plastic particles from Knoxville, TN to Paducah, KY. Thus we are not dealing only with inputs from particular cities or industrial zones. We as a society are responsible for this plastic load in the river.
Why are microplastics in our waterways an issue? After all, plastic can be swallowed without negative side-effects by animals and people, right? This would be largely true if organisms consumed clean plastic. But plastic particles in a river have been exposed to a host of man-made chemicals that like to stick to their surfaces. Chemicals that include pharmaceuticals, PCBs and heavy metals. In addition to sampling for microplastics during the Tenneswim we also sampled for hundreds of man-made chemicals and heavy metals. What we found was a cocktail of chemicals like anti-seizure medications, blood pressure medications, over a dozen pesticides, pain killers, artificial sweeteners, contrast agents for x-ray and MRI procedures, caffeine, sunscreen ingredients, perfluorinated compounds (PFCs), and a host of other chemicals. That means that each plastic particle acts as a potential transport agent for some of these chemicals. We know that this has caused serious disruption of physiological processes in some river invertebrates (e.g., endocrine disruption), but we don’t yet know about the effects on fish – or humans that drink river water.
The American Paddlefish is a Tennessee River inhabitant that feeds on zooplankton. It is not known what impacts (if any) microplastics have on its physiology.
As I watch Andreas swim I realize that this means he is carving his way through thousands of plastic particles every few seconds. This also means that the Tennessee River is dumping 32 million plastic particles into the Ohio River every second.
As we emerge from a bend in the river I can see the big, orange buoy that marks the finish line off in the distance. Another 20 minutes and we reach it, Andreas coming in third out of a field of over 100 participants. We leave the water, but the microplastics continue on their journey to the Ohio, then the Mississippi, and ultimately the Gulf of Mexico. There they add to the 9 million tons of plastic entering the oceans annually. Estimates are that if things continue unabated, there will be more plastic particles in the ocean than fish by 2050.
The Hiwassee River is one of the largest tributaries feeding the Tennessee River. It has its origins to the east, high in the mountains of the Blue Ridge. As it spills out of the mountains it is joined by the equally large Ocoee River, but maintains the name Hiwassee. Both the Ocoee and Hiwassee have cut deep, scenic gorges into the ancient rocks of the Blue Ridge. This is the state’s premier whitewater rafting area. The Ocoee has a deep, troubled environmental history that began in the 19th Century. This history is largely unknown to the tens of thousands of tourists that enjoy the river’s whitewater and scenic beauty and the easy access afforded by highway 64, which runs like a ribbon alongside the river. High on the Ocoee’s watershed is the bowl-shaped valley called the Copper Basin, where copper and other metals were discovered in the 1840’s. Soon the region became the largest copper mining district in the eastern United States. The copper occurred in ore, meaning the metal was disseminated through the rocks and difficult to extract. The process of getting the copper out of the ore was done on site, using large volumes of firewood harvested from the local forests to roast the ore. Aside from denuding the local forests, this roasting process had a more sinister side effect. The ore also contained large amounts of elemental sulphur which, when released into the air during the roasting process, formed sulphuric acid in the sky above the Copper Basin. Rains brought this acid down as a caustic mist over the basin and lead to the annihilation of all existing vegetation. Soon the Copper Basin became a moonscape, made famous by several photographs like one below.
Denuded landscape of the Copper Basin.
The soil became sterile and, lacking any vegetative cover, succumbed to massive erosion. Local streams transported the sediment load to the Ocoee, which by 1912 had already been dammed in several locations. These dams pre-dated the Tennessee Valley Authority and provided electricity to eastern portions of the state. One dam location was chosen at the entrance to the Ocoee River gorge, a narrow spot where the river exits the Blue Ridge between two high knobs of rock. This dam forms the extensive Parksville Lake. Sediment from the denuded lands upstream soon became trapped behind the dam, replacing much of the water with solid grains of weathered rock and soil. If the lake level drops just a foot or two today, the lake waters in the upper reaches suddenly disappear and a vast mudflat appears. In these areas Cypress trees have been planted and are a testament to the shallow nature of the lake. It wasn’t until the 1970’s that suitable pines became available to revegetate the Copper Basin. Now the basin is green and lush again, with place names like “Bura-Bura”and “Copper Hill”, the occasional mine tailings pile, and the lake sediment the only visible evidence of these former times.
View of Parksville Lake from Chilhowee Mountain. The lake is formed by a dam (Ocoee #1) between the two knobs at right margin of photo.
The booming whitewater industry is relatively new, having begun in the mid-1970’s when the damaged flume which carries water to one of the power stations was closed for repairs. This meant that water that was usually carried from the river and caused the Ocoee to be in an almost constant state of dryness found itself flowing free again in the river bed. Boaters quickly discovered the possibilities and after much back and forth with TVA, commercial boating on the river became a big-business, permanent fixture. In 1996 the Ocoee River was chosen as the site for Atlanta’s Olympic whitewater events. A portion of the river bed was completely re-engineered to produce the proper rapids needed for an Olympic event. The Olympic whitewater center remains a major tourist attraction for swimmers at low water and boaters at high water.
Watching the action at the Olympic Whitewater section on the Ocoee.
The 2014 water crisis in Flint, Michigan brought forth the realization once again that public water supplies were prone to contamination by dangerous chemicals. In the case of Flint, it was elevated levels of lead that caused alarm. Lead is a toxic metal that can build up in the body over time and can severely affect mental and physical development, especially among children (including lower IQ and increased hyperactivity). When Flint changed its water source from Lake Huron to the more corrosive waters of the Flint River, lead began to leach from the aging plumbing system and entered homes where it was consumed and used for bathing and washing. Some homes showed levels at a staggering 13,000 parts per billion (ppb), well above the Environmental Protection Agency’s (EPA) action level of 15 ppb. The shock continued as other communities discovered elevated lead levels in their water supply systems. The state of Maryland found that seven primary and secondary public schools had high levels of lead in their drinking water. Soon municipalities around the country were scrutinizing their water supplies more closely.
Lead in water doesn’t just get there from corroding pipe systems that are made of lead. Many locations around the world have naturally occurring lead in rock, sediment and soil. If groundwater in these areas is the drinking water source, then lead contamination can be expected. Lead mines often lead to groundwater contamination, as was the case in Picher, Oklahoma, which was declared a superfund site by the EPA. Its more than 1500 residents were mostly bought out by the federal government and the municipality has been a ghost town since its last resident died in 2015. Lead contamination from non-water sources, such as old lead paint in houses, may prove to be an even larger threat that water-borne lead.
What about the quality of water in Sewanee? If you are on the Sewanee Utility District’s (SUD) water supply system, then your water comes from our reservoir lakes (O’Donnell and Jackson). This water has either flowed across the ground or leached through the soil and rock into the reservoirs. Happily, the substrate in the area is very low in metals that are of concern in drinking water, including lead. After cleaning and chlorination at the filtration plant the water is sent on its way through pipes to town buildings. The pipes are made of various metals and plastics that could contribute some of their constituent materials to the water. One of my environmental science classes recently had tap water analyzed that was sampled from 24 University buildings (no private homes or businesses were sampled). The results indicate very low concentrations of 59 inorganic elements (metals) commonly found in tap water. Not only were metals well below the maximum allowable levels for drinking water as outlined by the EPA, but some metals of particular concern, like lead, were at such low levels that they could barely be detected.
Iron, which is classified by EPA as a secondary contaminant, can be a nuisance in well and lake water on the Cumberland Plateau, staining laundry and plumbing fixtures pink. It is found at such low levels in our tap water that one would have to drink about 180 liters of it to get the same amount present in a single typical, iron-bearing children’s vitamin. This is the most extensive sampling ever done for inorganic elements in tap water on the campus (note that other contaminants and biological components were not analyzed). The results were shared with the Sewanee Utility District and will contribute to a much more complete picture of Sewanee’s drinking water quality. Bottoms up!


 The 2014 water crisis in Flint, Michigan brought forth the realization once again that public water supplies were prone to contamination by dangerous chemicals. In the case of Flint, it was elevated levels of lead that caused alarm. Lead is a toxic metal that can build up in the body over time and can severely affect mental and physical development, especially among children (including lower IQ and increased hyperactivity). When Flint changed its water source from Lake Huron to the more corrosive waters of the Flint River, lead began to leach from the aging plumbing system and entered homes where it was consumed and used for bathing and washing. Some homes showed levels at a staggering 13,000 parts per billion (ppb), well above the Environmental Protection Agency’s (EPA) action level of 15 ppb. The shock continued as other communities discovered elevated lead levels in their water supply systems. The state of Maryland found that seven primary and secondary public schools had high levels of lead in their drinking water. Soon municipalities around the country were scrutinizing their water supplies more closely.